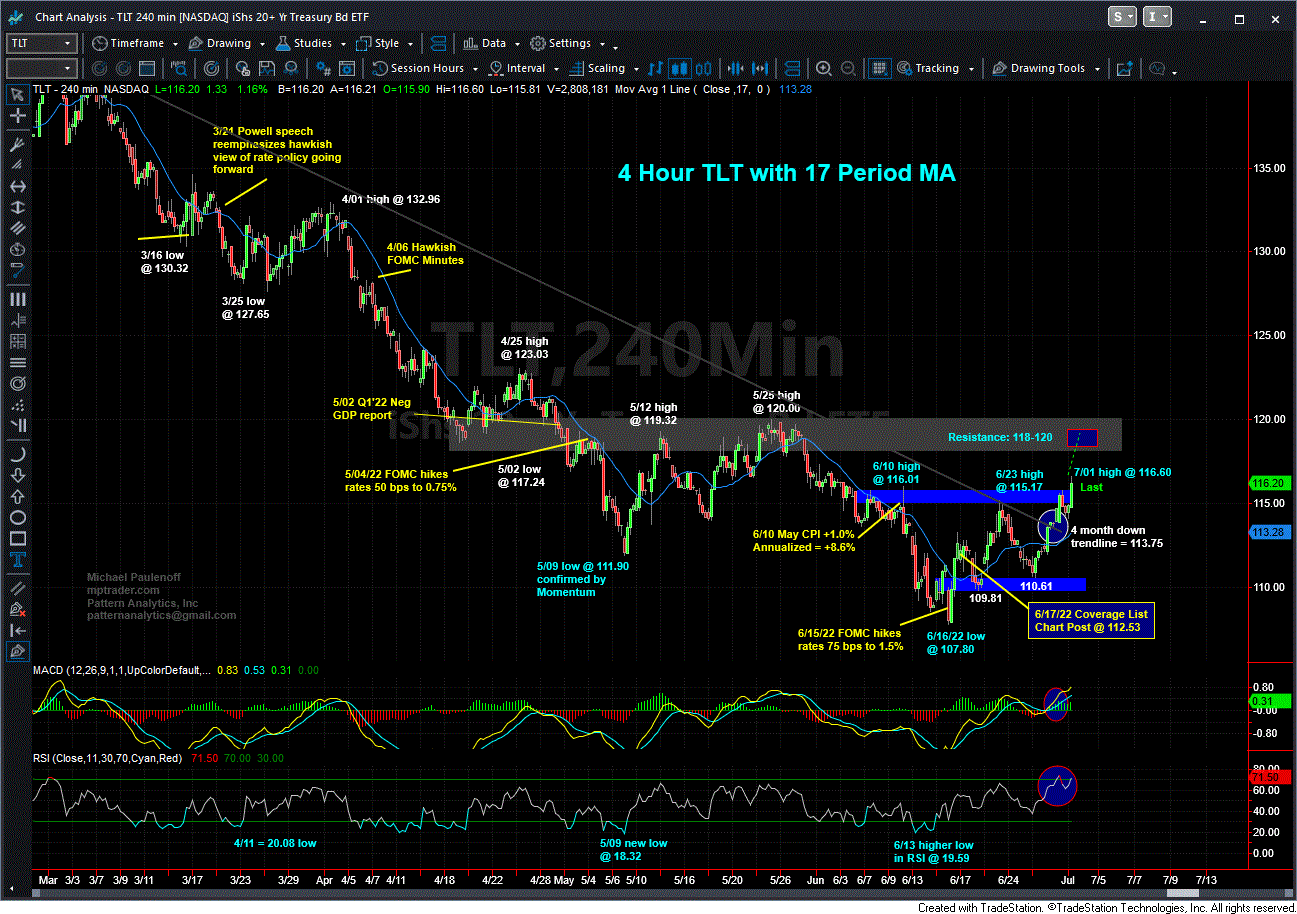
Back on June 17th, this is what we discussed about the TLT (20+ Year T-bond ETF) when it was trading at 112.53:
"The TLT put in a big upside reversal day yesterday (6/16/22) from 107.80 to 111.72, closing RIGHT AT the High of 111.72, leaving behind a Bullish Engulfing Candle on my Daily Chart (not shown here). The last time TLT traded at 107.80 was on April 4, 2014!
"Until the upside reversal signal is discredited, my technical work indicates that the most recent downleg in TLT is complete, and has registered a significant trend change signal. While the 'most recent downleg' represents just the price action from the 5/25/22 recovery rally high at 120.00 down to yest's low at 107.80 (-10% shown on my attached 4 Hour Chart), the Bullish Engulfing Candle could very well have ended a much larger downleg from the 3/01/22 high at 142.33 into yest's low at 107.80 (-24.3%).
"In either case, Thursday's upside reversal signal in the TLT coming one day after the third Fed Rate Hike totaling 150 bps in 12 weeks, followed by today's extended strength of 0.9% exhibits initial staying power in a market that was unable to exhibit any at all for weeks.
"Purely from a technical perspective, however, THE CONSEQUENTIAL CHALLENGE REMAINS OVERHEAD, in the vicinity of near 4-month down trendline, which cuts across the price axis in the vicinity of 114.50 today and next Tuesday, and if taken out and sustained, will inflict meaningful damage to the bond (TLT) multi-month downtrend, and will trigger a next higher target zone of 118 to 120 where the TLT structure will be 'threatening' to put a major bottom (rather than a technical low)...
"Based on my near-term work, TLT is a 'Buy and Hold' counter-trend position unless and until the 6/16/22 low at 107.80 is violated on a closing basis."
-----------------------------------
Fast-forward to this past Friday (July 1), we find the TLT has climbed to a new recovery rally high at 117.59 off of the 6/16 low at 107.80, clearing and accelerating to the upside from its former 4-month resistance line (113.75), and projecting next into that 118-120 target zone. No doubt, Mr. Bond Market is thinking and reacting to new perceptions either that inflation has peaked, or that the economy is slowing quickly, or both, which could push the Powell Fed to modify its very hawkish monetary policy prescriptions. Be that as it may, only a sudden downside reversal and close beneath 113.85 will compromise the still-powerful recovery rally period.