On Target with TGT

by Mike Paulenoff
September 19, 2014 • 12:00 AM EDT
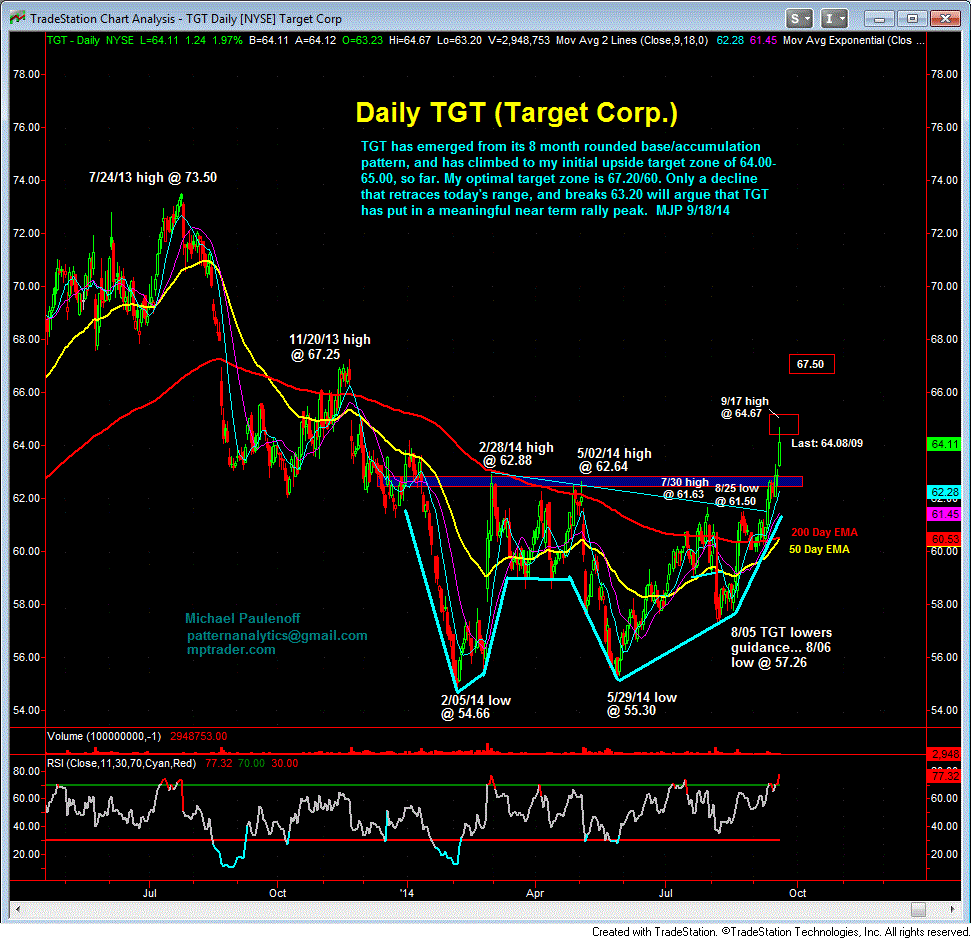
Two weeks ago, Mike added Target (TGT) as a short-term trade set-up, seeing, from a technical perspective, that the multi-month base pattern was putting increasing upward pressure on the price structure, and that, from a macro view, TGT represented a defensive play in an otherwise overbought equity market condition.
Mike noted that since its sell-off after lowering guidance on August 5, the stock had moved above its 50- and 200-day EMA's and was approaching a key resistance band. "A climb through the resistance will confirm the breakout from a 10-month base formation that will project towards a 70 target zone in the weeks thereafter."
Trading at 61.06 at the time, Target (TGT) has since rallied 5% to a high of 64.65 on Thursday September 18.
See Mike's latest chart on Target below.
Mike Paulenoff is the author of MPTrader.com, a real-time diary of his technical analysis & trade alerts
on
ETFs for precious metals, energy, currencies, and an array of equity indices and sectors, including
international
markets, plus key ETF component stocks in sectors like technology, mining, and banking.
Sign up for a Free 7-day Trial!
More Top Calls From Mike
Last Tuesday afternoon, hours before CAVA (Cava Group) was scheduled to report Earnings, this is what I posted for MPTrader members:CAVA reports Earnings after today's close. Approaching the news, CAVA is circling 61, a full 40% beneath its April 2026 high at 98.79, amid an unconfirmed new corrective low at 60.21 yesterday (8/10/26), leaving CAVA positioned for a "buy-the-news" setup (the opposite of a sell-the-news setup in a name that is up 30% to 40% approaching Earnings).
Good Sunday Afternoon, MPTraders! Last Thursday afternoon, ahead of AAPL's Earnings, this is what we discussed about the stock's probable price path in reaction to the news:Unless AAPL produces something extraordinary, or otherwise announces some unknown bullish catalyst, my pattern work has a very difficult time expecting anything other than a "best-case" sell-the-news scenario in reaction to Earnings. I can make a compelling argument that the upleg from the 6/26/26 low at 273.33 to the 7/29/26 ATH at 344.
XOM (Exxon Mobil)-- Back on May 19, 2026, a fellow MPTrader member requested an update on XOM. This is what we discussed at that time:My attached Daily Chart setup shows my preferred scenario calling for a near-term peak of the current upmove from the 4/17 low at 141.97 to a target zone from 162 to 165, followed by a rollover and press lower that revisits and possibly breaks the 41/7 low, which also will complete the larger corrective process from the 3/30/26 ATH at 176.41.
Pharma Update: MRK and LLYOn Wednesday (6/24/26), this is what we discussed about MRK:MRK as well, which we see on my attached Daily Chart exhbits a VERY BULLISH technical setup-- quite the opposite of beleaguered PFE. My pattern work argues that all of the price action from the 2/25/26 high at 125.14 represents a high-level bullish digestion period and pattern atop the major upleg from the May 2025 low at 73.31.
On January 2, 2026, this is what I posted about CAVA (Cava Group Casual Mediterranean Cuisine) to MPTrader members:After CAVA's meteoric climb from 29.00 in October 2023 to an ATH at 172.65 in November 2024, the stock rolled over into a relentless decline that hit its low at 43.