Out Front Of HD's Price Reversal

by Mike Paulenoff
May 23, 2021 • 10:54 AM EDT
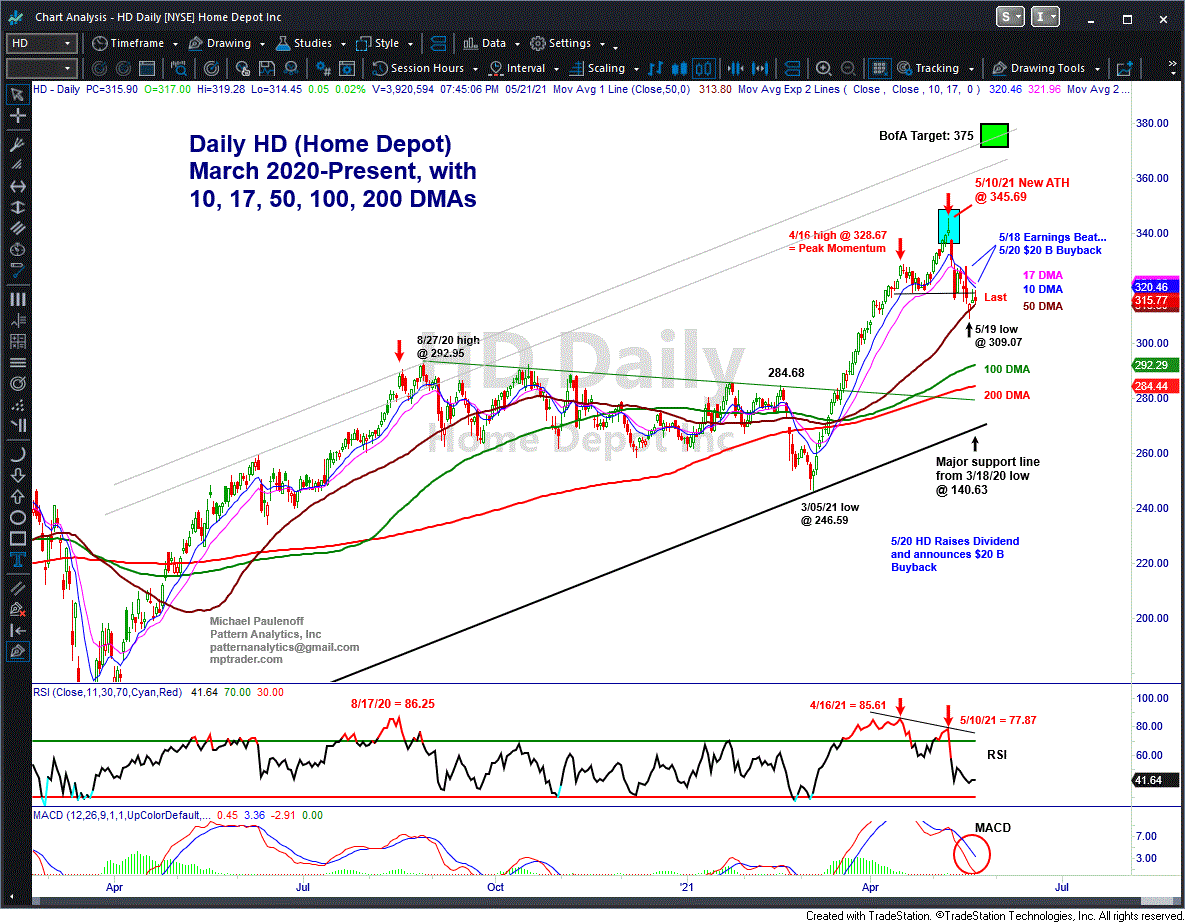
After Home Depot (HD) announced earnings on Tuesday that beat the Street on most of the important metrics, goosing the stock to the 327.25 area, Mike Paulenoff cautioned MPTrader members.
He briefly discussed HD's near-term technical set up, which looked promising as long as HD held support above 315.21, but then added:
"From a Bigger Picture perspective, my work presents some less promising prospects for HD's potential upside price path. Let's notice on my attached Daily Chart that the last time HD's Price AND Momentum hit confirming new highs was on April 16th. The subsequent new ATH in price at 345.69 on May 10th was NOT CONFIRMED by Daily Momentum, and as such, represents a glaring non-confirmation that serves as a warning signal to anyone who is camped-out in an entrenched long position -- that the power driving HD higher has dissipated, and continues to dissipate as price moves higher."
Later that day, HD reversed sharply, closing lower on the session, injecting serious negativity into Mike's near and intermediate technical work.
The poor performance of HD's stock did not go unnoticed by HD management. On Thursday afternoon after the close (at 315.90), HD "surprised" The Street by authorizing a new $20 billion share repurchase program.
On Friday, after popping higher to 319.28, HD closed the session lower, at 315.77, despite the influence of Tuesday's strong earnings report and Thursday's stock buyback announcement.
HD's poor stock performance certainly appears to be reflecting Mike's problematic "bigger picture" technical set-up.
What's next for the price of HD? Will it continue to hold above its 50 DMA (now at 313.80)? If not, to what target zones does Mike's work project weakness? Will HD weakness weigh on overall market direction?
Join Mike and MPTrader members for discussions about HD, as well as many individual stocks, ETFs, macro indices, cryptos, and commodities.
On May 6, 2025, during the final hour of trading, and before AMD was scheduled to report quarterly Earnings that evening, I posted the following analysis to our MPTrader Discussion Room:AMD reports Earnings after the close... The only conviction I can derive from my pattern work is that the 4/08/25 low at 76.48, which represented a 66% correction from the March 2024 high at 227.30, has the right look of a significant low that completed a major bear phase.
On April 22, 2025, I posted the following analysis about my technical setup work in XBI (SPDR SP Biotech ETF):XBI (SPDR SP Biotech ETF)-- Could it be? Could it be that the near-40% correction from the 11/11/24 multi-year high at 105.47 to the 4/09/25 low at 66.66 fully discounted all the bad news in this sector? From a BIG Picture perspective, my attached Daily Chart shows this month's spike low into the vicinity of the previous major corrective low-zone starting in May 2022.
In the early afternoon on April 11, this was my note to our members:"IBIT (iShares Bitcoin Trust ETF)-- From a trading perspective, anyone who is in sync with the Bitcoin setup might consider owning IBIT (iShares Bitcoin ETF) against a stop below its 4/07/25 low at 42.98 (see my attached Daily Chart below)...
Last Thursday (4/17/25) afternoon, ahead of NFLX (Netflix) post-close earnings report and the three-day Good Friday holiday weekend, we discussed the technical setup and whether or not the NFLX pattern was positioned to react positively to the news : The NFLX setup heading into Earnings later today is favorable for upside continuation above the prior two rally highs at 993.45 (4/15) and 998.70 (3/25), but not to a new ATH above 1064.
Last Thursday afternoon (4/10/25), the commentary below is what I discussed with MPTrader members about my Big Picture technical setup work: Tomorrow is the final session of the week. We get some big bank Earnings and PPI before the open, and more than likely, one or more POTUS televised events that undoubtedly will move markets one way or other. Technically, tomorrow's (Friday) close will be important to my Weekly Chart Work.