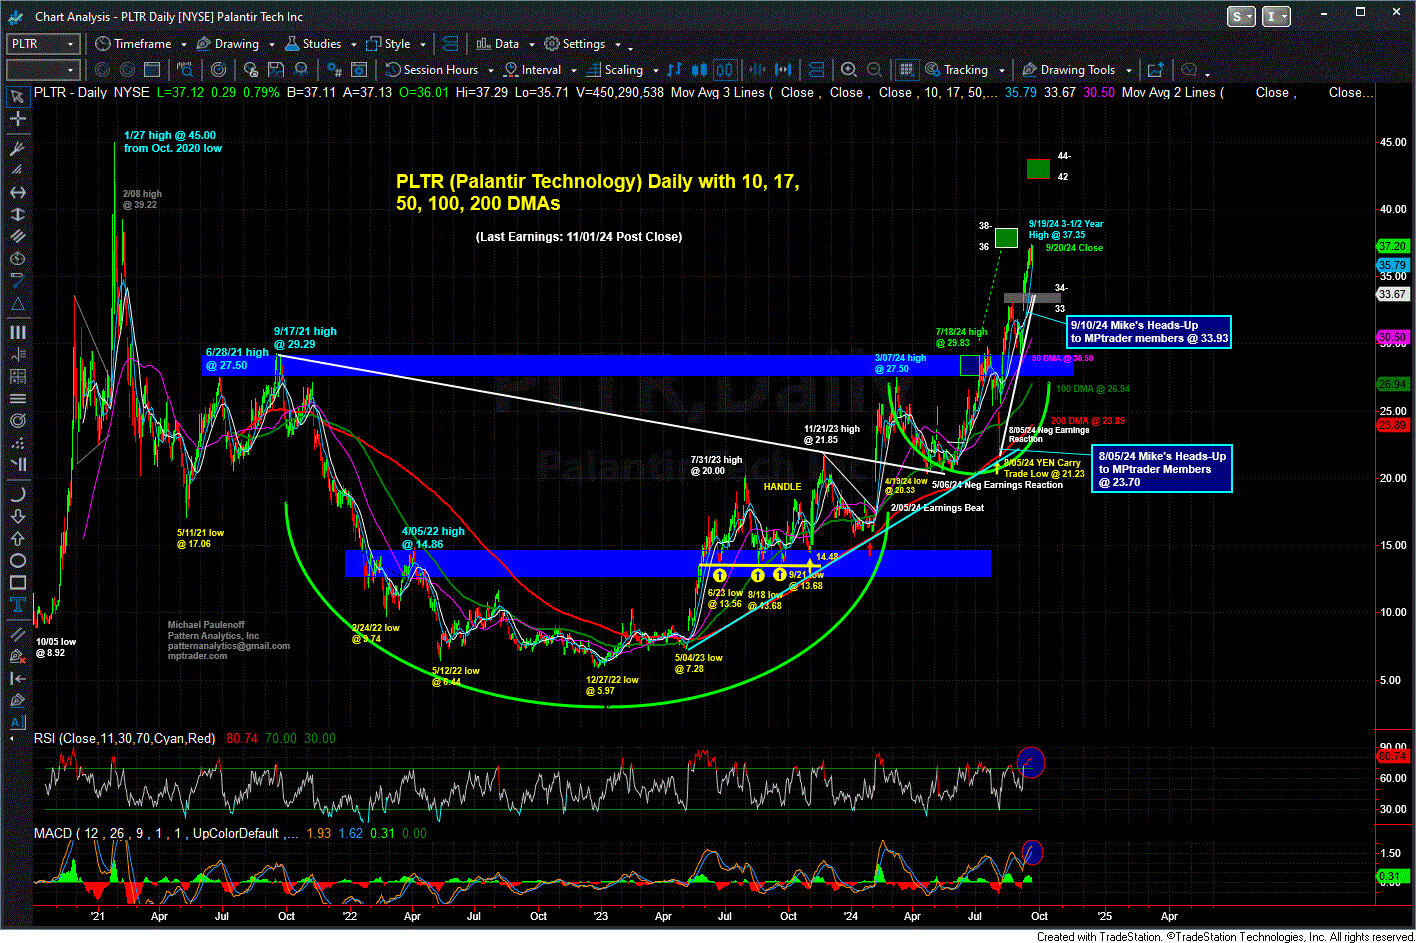
PLTR +57% Since Our Aug 5th Alert
by Mike Paulenoff
September 22, 2024 • 9:28 AM EDT
On August 5, hours before its after-market earnings report, Mike Paulenoff posted a bullish alert on AI-juggernaut PLTR, writing:
"Bottom Line Technically: As long as any forthcoming weakness on a closing basis remains above key support lodged between 19.60 and 21.50, PLTR has the right look of nearing the completion of the correction from its 7/08/24 high at 29.83, and the initiation of another advance that will extend the upside potential off of a two-year base-accumulation setup."
The stock, trading at 23.70 at the time, went on to rally over the next month. It was trading at 33.93 on September 10, when Mike posted this follow-up:
"If I was bullish on PLTR during its May-July upleg from 20 to 30, my intermediate-term set-up work is even more bullish now (its inclusion in the SP500 Index certainly helps !...) My attached Daily Chart exhibits a powerful upside breakout (8/12/24) from a massive 3-1/2 year base-accumulation period and pattern that has triggered a series of upside target windows at 36-38 (almost met at today's high of 35.20), 42-44, and 49-51. My pattern analysis indicates that downside risk along the road to the higher targets is concentrated initially at 31.50-32.50, but in the volatile September-October seasonal period, I cannot rule out a bout of pullback weakness into the vicinity of the sharply up-sloping 50 DMA, now pushing north of 29.00 ahead of my expectation of another powerful advance. In other words, weakness from 32.50 down to 29.00 is considered fertile territory for new buying."
Fast-forward to last week. PLTR closed at a new 3-1/2 year high of 37.20, a 57% increase from Mike's August 5th alert and nearly 10% above his September 10th update.
What's next for PLTR? Is the advance exhausted, and where might a bout of weakness find new buying interest? If not, where is Mike's next higher optimal Target Window where profit-taking is highly likely?
Login this week to follow Mike's frequent PLTR updates, as well as technical and fundamental discussions with MPTrader members about many individual stocks, sector ETFs, big-picture macro indices, precious metals, commodities, and Bitcoin.
On August 27, 2024, I reviewed my near and intermediate-term technical setup on copper (gold, silver, oil) producer FCX (Freeport-McMoRan) for MPTrader members, writing:My attached Daily Chart shows the 30% correction from the May 2024 high to the August 2024 low, which my pattern work argues ended the retracement of the first upleg of a new bull phase in FCX that began at the 10/23/23 low of 33.08 and ended at the 5/20/24 high of 55.24. The August 2024 upmove from 39.08 (8/05/24) to 46.
Three hours before the July Fed 31, 2024 (FOMC) meeting, I posted the following chart commentary about my technical setup work on 10-year Treasury YIELD and its actionable longer-term Treasury bond ETF, the TLT (20+ Year T-bond, ETF):Heading toward Fed Time, 10-year YIELD and TLT (20+ Year T-bond ETF) certainly appear to be anticipating lower interest rate news or innuendos from the FOMC statement (guidance) and Jay Powell in his post-meeting press conference.
On August 15, with XLV (Healthcare SPDR, ETF) approaching Mike Paulenoff's target zone (noted in an April 18th post), Mike responded to an MPTrader member's question about whether it was "time to sell and find something with more potential?" Mike wrote: "My short answer: no, it is not yet time to sell (although I will never dissuade anyone from taking profits and from ringing the cash register). My pattern and momentum work argue that upside potential extends from 156 to 161.
On August 6th, when UBER was trading 62, this is what Mike Paulenoff discussed with MPTrader members about the stock's technical setup in the immediate aftermath of the company's quarterly earnings report:"UBER... produced stellar earnings, albeit a bit light on next quarter's bookings. The stock is up 5.9% in pre-market trading within a near-term setup that argues yesterday's spike low at 53.25 ended a 35% correction off of the March high at 82.14.
At 10:45 AM ET on Friday July 26, 2 hours 15 minutes after the release of important PCE (Personal Consumption Expenditure) inflation data, this is what Mike Paulenoff discussed with MPTrader members about SPY (SPDR SP500 ETF):"If I have a concern today it is the unfilled up-gap left behind from last eve's 4 PM ET close at 538.32 to the low of the AM session so far at 541.25.