Prescient Analysis on Carvana
by Mike Paulenoff
December 17, 2023 • 11:56 AM EST
On November 7, 2023, we posted to our MPTrader members about the bullish technical setup in the e-commerce used car business, CVNA (Carvana Co), writing:
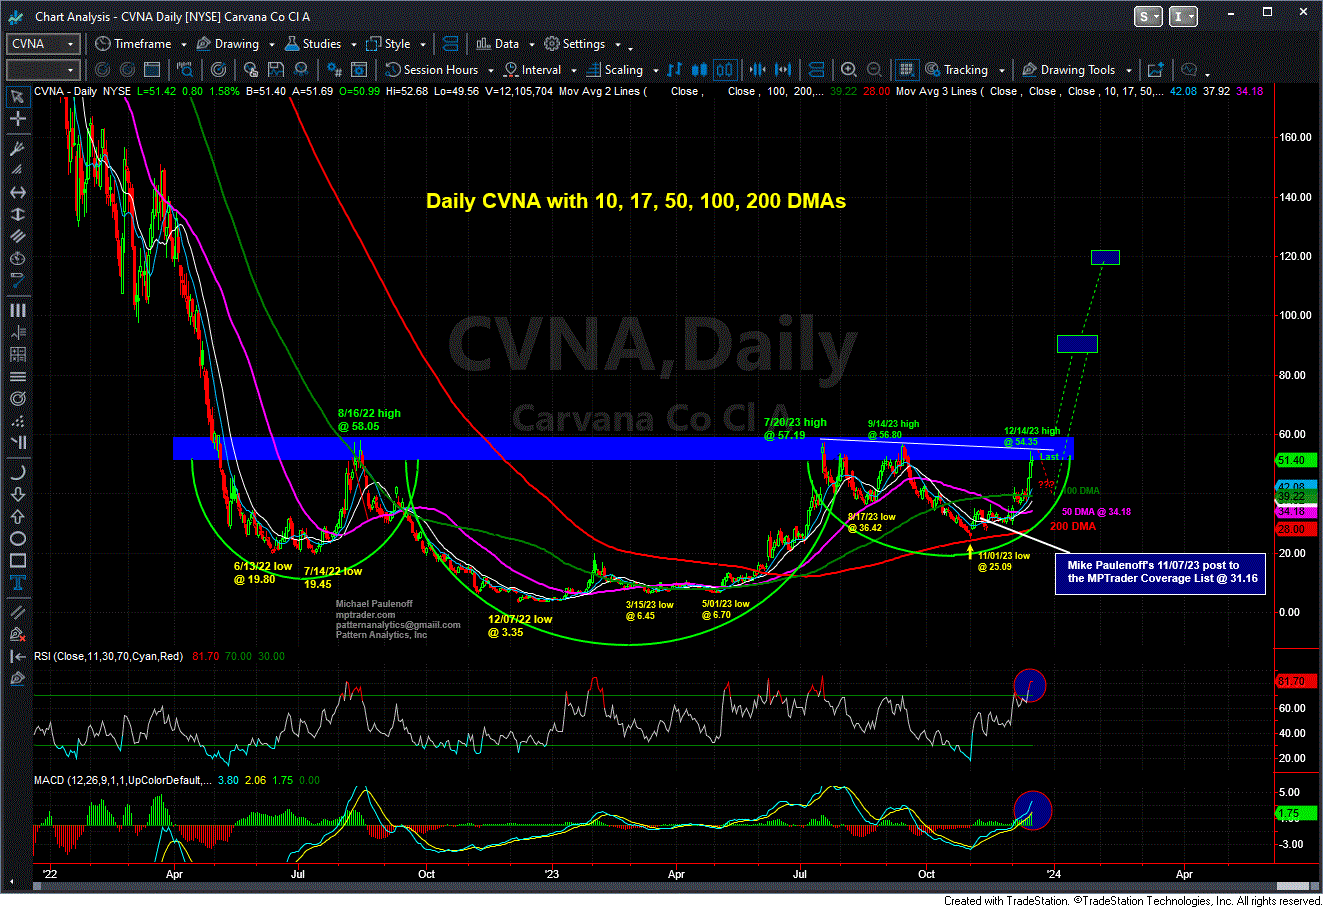
"CVNA exhibits a HUGE 19-month base accumulation period and pattern that has significant upside potential if and when the stock recovers to and takes out heavy resistance lodged between 50.60 and 57.20... My pattern work in CVNA from the Dec. 2022 low at 3.35 indicates that the advance to its July 2023 high at 57.19 exhibits bullish form, and was followed by a completed major correction into last week's low at 25.09. The upmove off of the 200 DMA last week has the right look of the initiation of a new, very powerful next upleg in CVNA provided any forthcoming acute weakness is contained above the 200 DMA. For anyone who has a time horizon of 12 months, and who can risk the 200 DMA, CVNA has the potential risk reward of 9 points on the downside versus 50+ points on the upside... Last is 34.16..."
During the ensuing 6 weeks since our update, CVNA has ripped higher to last Thursday's (Sep 14) three-month price peak at 54.35 (see daily chart below). That's a whopping 59% from where CVNA was trading on November 7, which reminds us about a prescient comment we made back on September 1 during one of our frequent CVNA pattern development updates:
"If the near and intermediate-term patterns exhibited by CVNA follow the projected bullish scenario, then we will have to think that the US economy is hitting on most of its cylinders AND that car loans and the interest rates on those loans will be much more attractive than they have been during the past year..."
After last week's apparent Fed Pivot on the direction of monetary policy (a transition from very restrictive to modestly accommodative), the combination of a plunge in interest rates and the perception (if not the reality) that disinflationary pressure will continue to drive the CPI and the PCE inflation gauges closer to the Fed's 2% target considerably sooner than expected without a significant fallout in the jobs market is perhaps Nivana for the business of Carvana!
What do we see next for CVNA heading into the end of the year and thereafter, into Q1, 2024? Judging from the technical setup, CVNA's future looks extremely promising.
Join us and our MPTraders heading into 2024 for their intraday discussions about CVNA as well as many other individual stocks, Magnificent 7 setups, sector ETFs, macro indices, commodities, and Bitcoin.
Mike Paulenoff is the author of MPTrader.com, a real-time diary of his technical analysis & trade alerts on
ETFs for precious metals, energy, currencies, and an array of equity indices and sectors, including international
markets, plus key ETF component stocks in sectors like technology, mining, and banking.
Sign up for a Free 7-day Trial!
More Top Calls From Mike
Over one month ago, on Monday morning, 9/09/24, I posted the following NVDA update for our members:My near-term pattern work makes a compelling argument that the corrective downleg from the 8/16 high at 131 is nearing downside exhaustion and completion in and around 100 (Friday's low was 100.95). That said, unless and until NVDA climbs above 106.30 to 108.
On August 27, 2024, I reviewed my near and intermediate-term technical setup on copper (gold, silver, oil) producer FCX (Freeport-McMoRan) for MPTrader members, writing:My attached Daily Chart shows the 30% correction from the May 2024 high to the August 2024 low, which my pattern work argues ended the retracement of the first upleg of a new bull phase in FCX that began at the 10/23/23 low of 33.08 and ended at the 5/20/24 high of 55.24. The August 2024 upmove from 39.08 (8/05/24) to 46.
On August 5, hours before its after-market earnings report, Mike Paulenoff posted a bullish alert on AI-juggernaut PLTR, writing:"Bottom Line Technically: As long as any forthcoming weakness on a closing basis remains above key support lodged between 19.60 and 21.50, PLTR has the right look of nearing the completion of the correction from its 7/08/24 high at 29.83, and the initiation of another advance that will extend the upside potential off of a two-year base-accumulation setup."The stock, trading at 23.
Three hours before the July Fed 31, 2024 (FOMC) meeting, I posted the following chart commentary about my technical setup work on 10-year Treasury YIELD and its actionable longer-term Treasury bond ETF, the TLT (20+ Year T-bond, ETF):Heading toward Fed Time, 10-year YIELD and TLT (20+ Year T-bond ETF) certainly appear to be anticipating lower interest rate news or innuendos from the FOMC statement (guidance) and Jay Powell in his post-meeting press conference.
On August 15, with XLV (Healthcare SPDR, ETF) approaching Mike Paulenoff's target zone (noted in an April 18th post), Mike responded to an MPTrader member's question about whether it was "time to sell and find something with more potential?" Mike wrote: "My short answer: no, it is not yet time to sell (although I will never dissuade anyone from taking profits and from ringing the cash register). My pattern and momentum work argue that upside potential extends from 156 to 161.