SLB Meets Levels Outlined For Upside Reversal

by Mike Paulenoff
March 24, 2024 • 10:34 AM EDT
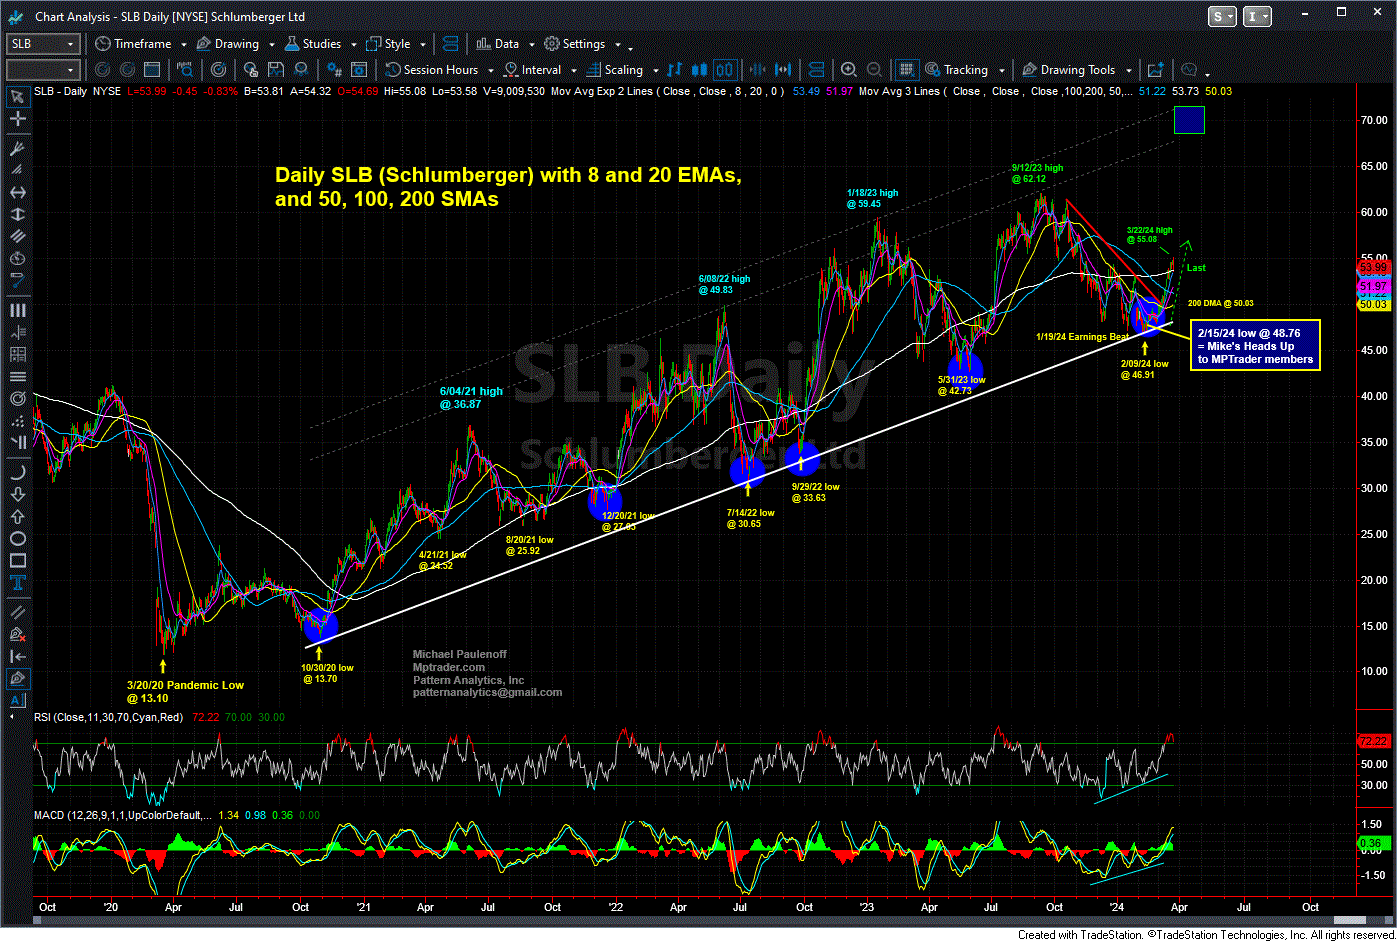
During the afternoon session of February 15, this is what Mike Paulenoff posted to the MPTrader Discussion Room about the technical setup in the oil service company SLB (Schlumberger):
"This name in the oil service sector exhibits a well-demarcated 4-year bullish channel with the SLB price structure upturning off of the lower boundary line in the vicinity of 47.00 (the 2/13/24 low) amid a glaring double non-confirmation of the weakness into the lower channel line. Although my work argues that SLB is in a U-Turn to the upside, an initial climb and close above 49.50 is needed to improve technical confidence, and a close above the 200 DMA, now 50.21 will confirm the turn. Last is 48.76..."
One week after the update, SLB climbed above 49.50, improving Mike's technical confidence in a significant upside price reversal, and has since rallied to last Friday's high of 55.08, a full 13% above Mike's initial heads up.
What's next for the direction of SLB? Will the stock attract buyers into next week's runway into the end of Q1, 2024? How will the price of Crude Oil play into the near and intermediate-term prospects for SLB?
Login this week to join Mike and MPTrader members to find out, and for their timely, opportunistic intraday discussions about SLB as well as many individual equity names, macro indices, sector ETFs, commodities, currencies, and Bitcoin.
Mike Paulenoff is the author of MPTrader.com, a real-time diary of his technical analysis & trade alerts
on
ETFs for precious metals, energy, currencies, and an array of equity indices and sectors, including
international
markets, plus key ETF component stocks in sectors like technology, mining, and banking.
Sign up for a Free 7-day Trial!
More Top Calls From Mike
XOM (Exxon Mobil)-- Back on May 19, 2026, a fellow MPTrader member requested an update on XOM. This is what we discussed at that time:My attached Daily Chart setup shows my preferred scenario calling for a near-term peak of the current upmove from the 4/17 low at 141.97 to a target zone from 162 to 165, followed by a rollover and press lower that revisits and possibly breaks the 41/7 low, which also will complete the larger corrective process from the 3/30/26 ATH at 176.41.
Pharma Update: MRK and LLYOn Wednesday (6/24/26), this is what we discussed about MRK:MRK as well, which we see on my attached Daily Chart exhbits a VERY BULLISH technical setup-- quite the opposite of beleaguered PFE. My pattern work argues that all of the price action from the 2/25/26 high at 125.14 represents a high-level bullish digestion period and pattern atop the major upleg from the May 2025 low at 73.31.
On January 2, 2026, this is what I posted about CAVA (Cava Group Casual Mediterranean Cuisine) to MPTrader members:After CAVA's meteoric climb from 29.00 in October 2023 to an ATH at 172.65 in November 2024, the stock rolled over into a relentless decline that hit its low at 43.
On the morning of April 9, 2026, this is what I posted about SMR (NuScale Power Corp) to our Discussion Room for MPTrader members:SMR (Nuscale Power Corp)-- Three views of this beleaguered, former high-flying modular nuclear power producer that has been in the grasp of a relentless six-month, 84% bear phase:-- From the perspective of my 4-hour Chart, SMR has the right look of nearing the completion of the downleg that started at the Jan. 2026 recovery rally high of 22.
On the morning of April 7, 2026, this is what I posted for MPTrader members about my interpretation of the near-term technical setup exhibited by META:My preferred technical scenario for META argues that the stock established a significant near-term low at 520.00 on 3/27/26 that resides within an August 2025 to March 2026, incomplete larger corrective process.