SPY Put Trade Returns 100% as SPY Approaches Our Downside Target

by Mike Paulenoff
April 12, 2014 • 12:00 AM EDT
On Tuesday (April 8), Mike added the April 11 SPY 184 Put to the MPTrader short-term portfolio at a price of $0.93. He was looking for the underlying SPY, which was trading at 184.49/50 at the time, to fall into the 181 area into expiration on Friday.
The SPY indeed fell to under 182.00 on Friday morning, pushing up the put price to $1.83, at which point Mike issued an exit alert for a 100% return on the trade.
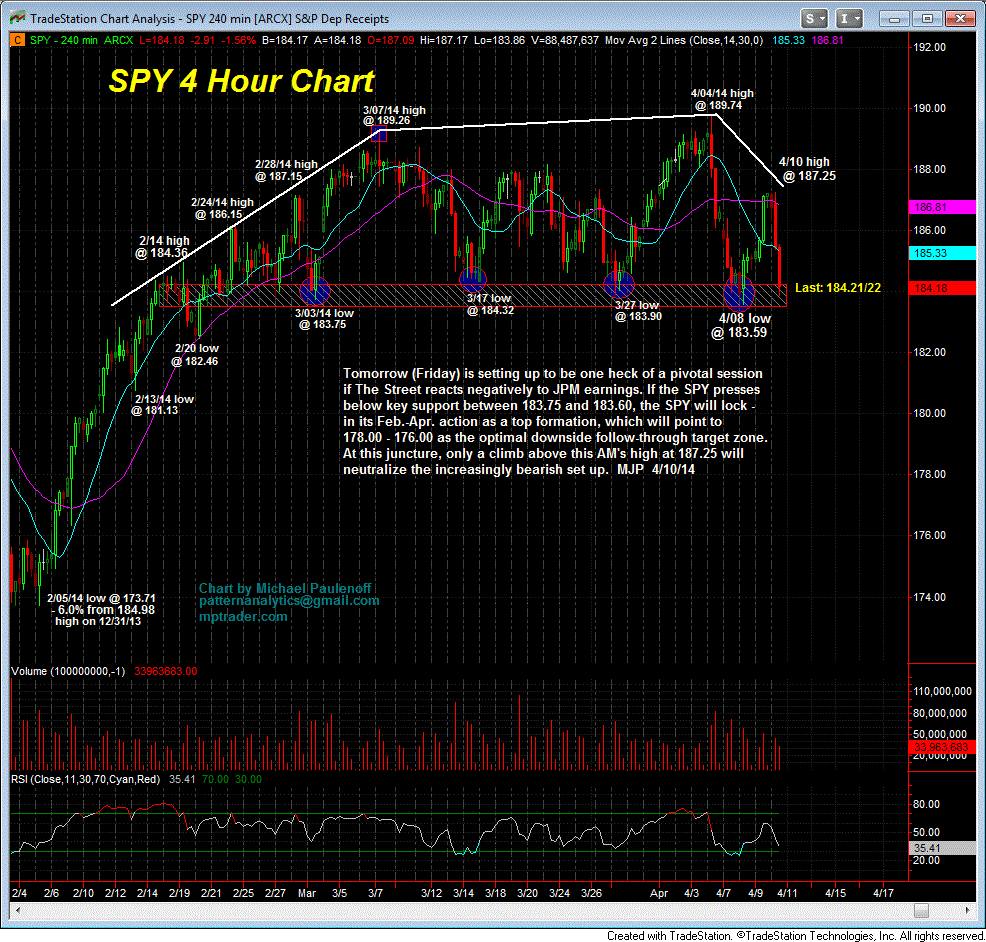
Having broken key support between 183.75 and 183.60, locking in the Feb-April action as a top formation, the SPY has a next downside target of 178-176.
See chart below from Tuesday.
Mike Paulenoff is the author of MPTrader.com, a real-time diary of his technical analysis & trade alerts
on
ETFs for precious metals, energy, currencies, and an array of equity indices and sectors, including
international
markets, plus key ETF component stocks in sectors like technology, mining, and banking.
Sign up for a Free 7-day Trial!
More Top Calls From Mike
Thirty minutes after the opening bell on November 24, 2025, I posted the following heads-up to MPTrader members about the technical setup in META:META has the right technical look of a significant U-Turn to the upside after completing a 27% August-November correction from 796.25 (8/15/25) to 580.32 (11/21/25)... To gain more powerful upside traction, META needs to climb and sustain above nearest-term resistance at 614.70 to 616.50, which if (when) taken out, will open a higher price pathway to the 670 area to challenge the down-sloping 200 DMA... Last is 609.27...
Last Friday morning, to calm frazzled nerves amid a 1% pre-market plunge that was threatening to complete a 100% give back of the prior week's 3.
Late on Friday, fellow MPTrader member MarkinQueens exclaimed: Mike's XOM (Exxon Mobil) chart from August is working! Last $117.26!Back on August 25th, this is what we discussed about Crude Oil and XOM:Just in case anyone is wondering what the chart of nearby Crude Oil is looking like as we approach the "official" end of summer.
On August 12, 2025, this was my response to an inquiry from an MPTrader member about intense weakness impacting SMR (NuScale Power Corp):SMR (NuScale Power)-- Fellow member Irv66 asked for an update on this modular nuclear reactor manufacturer that blasted-off from 11.08 in early April to 53.50 at the end of July (+382%), but has since been in the grasp of a major correction from 53.50 to 38.33 (-28.6%). My pattern work argues that SMR is nearing key support from 37.50 down to 33.
ARKK (ARK Innovation Fund, ETF)-- Back on August 20, 2025, this is what we discussed about ARKK:Fellow member Pawel has requested an update on Cathie Wood's fund, which in June thrust up and out of a 3-1/2 year base-accumulation period and pattern above 68.40/50 that subsequently climbed to my initial target in the vicinity of 80 (see my attached Daily Chart). Since the 7/21/25 high at 79.