Short-term Trading Success, Bigger-Picture Prospects for HIMX

by Mike Paulenoff
October 3, 2014 • 2:43 PM EDT
On Monday, Mike added Himax Technologies (HIMX) as a short-term trade set-up at around 9.55 and exited the following day (+5% gain) when his raised stop was hit at 10.07.
Mike re-entered the trade on Wednesday at 9.72.
While trading the short-term swings, Mike indicated on Monday why the stock meets his interest in the bigger picture in terms of both the macro and technical set-up.
He noted, "In an effort to hold equity in companies with stories that should withstand weakness in the major averages, I have been following HIMX closely of late, which is a high-tech name that manufactures integrated circuits for all of the gizmos like flat panel TVs, tablets, phones, etc, and supplies the huge and growing Asian market and manufacturers. Any company associated with China, Samsung, and Google in the high-tech gadget space-- and already has its bear phase in the rearview mirror -- should be on the front burner."
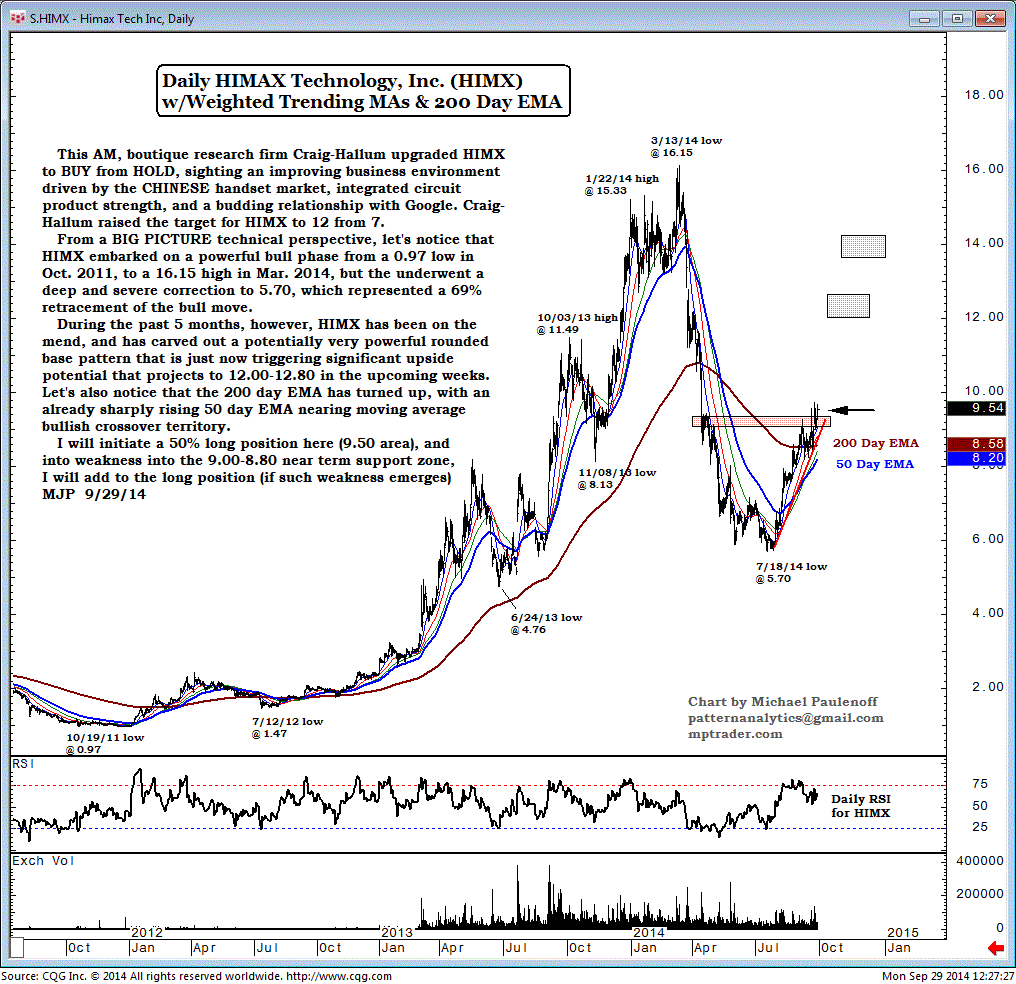
From a big-picture technical perspective, Mike noted that HIMX embarked on a powerful bull phase from the from the 0.97 low in Oct 2011 to the 16.15 high in Mar 2014, but then underwent a deep and severe correction to 5.70, which represented a 69.% retracement of the bull move.
"During the past 5 months, however, HIMX has been on the mend, and has carved out a potentially very powerful rounded base pattern that is just now triggering significant upside potential that projects to 12.00-12.80 in the upcoming weeks. The 200-day EMA has turned up, with an already sharply rising 50-day EMA nearing moving average bullish crossover territory."
Mike Paulenoff is the author of MPTrader.com, a real-time diary of his technical analysis & trade alerts
on
ETFs for precious metals, energy, currencies, and an array of equity indices and sectors, including
international
markets, plus key ETF component stocks in sectors like technology, mining, and banking.
Sign up for a Free 7-day Trial!
Thirty minutes after the opening bell on November 24, 2025, I posted the following heads-up to MPTrader members about the technical setup in META:META has the right technical look of a significant U-Turn to the upside after completing a 27% August-November correction from 796.25 (8/15/25) to 580.32 (11/21/25)... To gain more powerful upside traction, META needs to climb and sustain above nearest-term resistance at 614.70 to 616.50, which if (when) taken out, will open a higher price pathway to the 670 area to challenge the down-sloping 200 DMA... Last is 609.27...
Last Friday morning, to calm frazzled nerves amid a 1% pre-market plunge that was threatening to complete a 100% give back of the prior week's 3.
Late on Friday, fellow MPTrader member MarkinQueens exclaimed: Mike's XOM (Exxon Mobil) chart from August is working! Last $117.26!Back on August 25th, this is what we discussed about Crude Oil and XOM:Just in case anyone is wondering what the chart of nearby Crude Oil is looking like as we approach the "official" end of summer.
On August 12, 2025, this was my response to an inquiry from an MPTrader member about intense weakness impacting SMR (NuScale Power Corp):SMR (NuScale Power)-- Fellow member Irv66 asked for an update on this modular nuclear reactor manufacturer that blasted-off from 11.08 in early April to 53.50 at the end of July (+382%), but has since been in the grasp of a major correction from 53.50 to 38.33 (-28.6%). My pattern work argues that SMR is nearing key support from 37.50 down to 33.
ARKK (ARK Innovation Fund, ETF)-- Back on August 20, 2025, this is what we discussed about ARKK:Fellow member Pawel has requested an update on Cathie Wood's fund, which in June thrust up and out of a 3-1/2 year base-accumulation period and pattern above 68.40/50 that subsequently climbed to my initial target in the vicinity of 80 (see my attached Daily Chart). Since the 7/21/25 high at 79.