Sunday Afternoon, Bitcoin is Pushing Up Against its All Time Highs Again

by Mike Paulenoff
December 15, 2024 • 1:51 PM EST
Friday afternoon, fifteen minutes before the closing bell in the equity indices, this was my parting comment about Bitcoin:
Heading into the weekend, the technical setup argues against holding shorts in Bitcoin... no?...
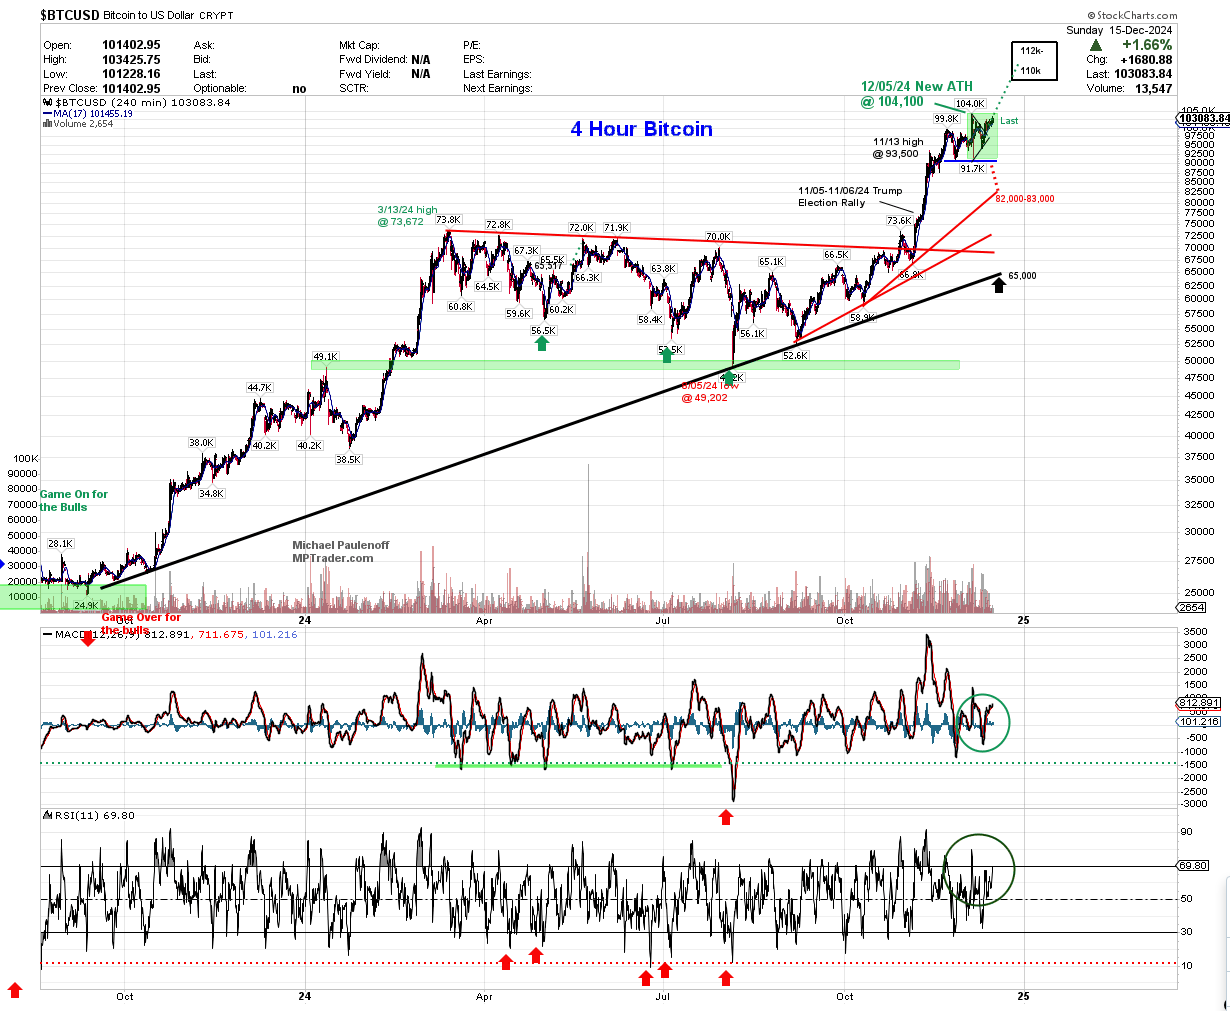
Less than 5 hours before the re-opening of the equity futures markets this evening, we find Bitcoin above 103,000 as it approaches a full-fledged retest of its 12/05/24 ATH at 104,100, which, if (when) hurdled and sustained, triggers a next projection in my work to 110,000-112,000, perhaps in route to much higher prices thereafter, and maybe a reflection of the pro-crypto incoming Trump Administration "normalizing Bitcoin" as a store-of-value by a finite-supplied asset that is adopted throughout the international financial community.
If Bitcoin is the new generational "digital gold," and it is widely adopted and accumulated by the incoming US Government as an anchor for the value of the Dollar and used to gradually pay down a gargantuan $36.23 trillion in sovereign debt (as of this morning), then just maybe the damaged perception of the once meaningful moniker the "full faith and credit of the United States of America" will be rehabilitated, and as such, so too will US fiscal health and America's ability to pay the interest on its debt at increasingly favorable rates... the opposite of the way things are heading at the moment...
This is just me thinking out loud, offering food for thought as we head into 4 years of positive disruption intended to "fix" America... Let's keep our fingers crossed! Last in Bitcoin is 103,177...
Mike Paulenoff is the author of MPTrader.com, a real-time diary of his technical analysis & trade alerts
on
ETFs for precious metals, energy, currencies, and an array of equity indices and sectors, including
international
markets, plus key ETF component stocks in sectors like technology, mining, and banking.
Sign up for a Free 7-day Trial!
More Top Calls From Mike
On January 2, 2026, this is what I posted about CAVA (Cava Group Casual Mediterranean Cuisine) to MPTrader members:After CAVA's meteoric climb from 29.00 in October 2023 to an ATH at 172.65 in November 2024, the stock rolled over into a relentless decline that hit its low at 43.
On the morning of April 9, 2026, this is what I posted about SMR (NuScale Power Corp) to our Discussion Room for MPTrader members:SMR (Nuscale Power Corp)-- Three views of this beleaguered, former high-flying modular nuclear power producer that has been in the grasp of a relentless six-month, 84% bear phase:-- From the perspective of my 4-hour Chart, SMR has the right look of nearing the completion of the downleg that started at the Jan. 2026 recovery rally high of 22.
On the morning of April 7, 2026, this is what I posted for MPTrader members about my interpretation of the near-term technical setup exhibited by META:My preferred technical scenario for META argues that the stock established a significant near-term low at 520.00 on 3/27/26 that resides within an August 2025 to March 2026, incomplete larger corrective process.
Thirty minutes after the opening bell on November 24, 2025, I posted the following heads-up to MPTrader members about the technical setup in META:META has the right technical look of a significant U-Turn to the upside after completing a 27% August-November correction from 796.25 (8/15/25) to 580.32 (11/21/25)... To gain more powerful upside traction, META needs to climb and sustain above nearest-term resistance at 614.70 to 616.50, which if (when) taken out, will open a higher price pathway to the 670 area to challenge the down-sloping 200 DMA... Last is 609.27...
Last Friday morning, to calm frazzled nerves amid a 1% pre-market plunge that was threatening to complete a 100% give back of the prior week's 3.