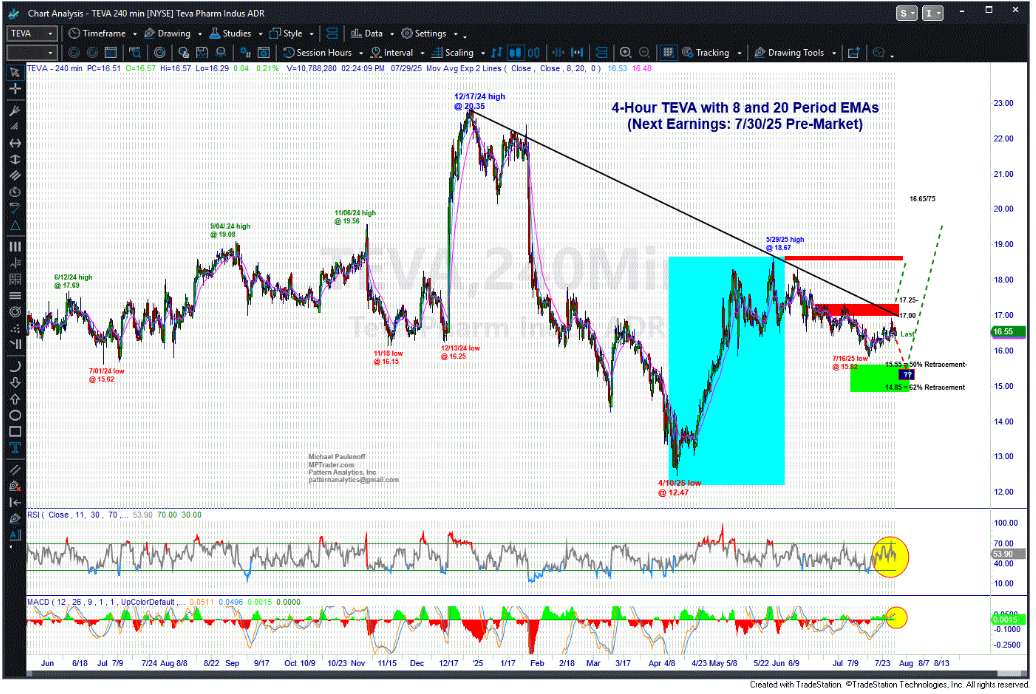
On July 29, 2025, this is what we discussed about TEVA (Teva Pharma), accompanied by my then-current 4-Hour Chart, just ahead of Earnings:
My attached 4-Hour Chart setup argues that TEVA is poised for upside continuation of its April-May advance (12.47 to 18.67) EITHER right from current levels in reaction to a positive Earnings Report tomorrow morning, OR into a BTD bout of weakness into the 14.85-15.55 target support window.
Only a disastrous Earnings report and/or guidance for the remainder of 2025 that presses TEVA below 14.85 on a closing basis will indicate that a very deep retracement of the April-May advance is in progress that could retest the April 2025 low-zone of 12.50 to 14.00... Last is 16.56...
(Continued below the chart)
Although investors initially reacted positively to TEVA's less-than-stellar Earnings report, the stock hit the skids on July 31st in reaction to the Trump Administration's Executive Order demanding that the major U.S. and foreign brand-name drug manufacturers lower their prices to match international prices. Since TEVA manufactures generic drugs, the company did not receive the EO letter sent to 17 major drug makers. However, on the afternoon of July 13, 2025, the baby was thrown out with the bathwater.
Along with the major drug makers, TEVA plunged from 17.00 to a low of 14.99 on 8/01/25, which happened to be right in my lower target window from 15.55 to 14.85.
TEVA has been rallying ever since...
Fast-forward to my update on Thursday, 8/14/25, a full 9 days and 18% above the 14.99 low after the EO plunge:
TEVA continues its recent climb, morphing both my 4-Hour and Daily Chart patterns into increasingly bullish setups... My attached 4-Hour Chart has the right look of a February-August Cup and Handle formation that appears to be emerging from the "Handle," into a powerful upleg extension, if preserved on a closing basis will be a very constructive technical "event" for the stock. Overall, the pivot low at 14.99 (8/01/25) and the ensuing upmove to today's high at 17.75 represents a new upleg in the bull phase that commenced at the 4/10/25 major corrective low at 12.47... Last in TEVA is 17.71...
My attached current 4-Hour Chart below shows a potentially powerful setup that is propelling the price structure toward a confrontation with significant resistance lodged from 18.20 to 18.70 that, if (when?) hurdled, will trigger a Bull Phase extension that projects to a retest of the December 2024 high-zone of 22.50 to 2282...
Join me and MPtraders this week as we analyze and strategize about TEVA as well as many other individual stocks, sector ETFs, macro indices, commodities, precious metals, and cryptocurrencies, all overlaid on Earnings, Jackson Hole, amid a fluid domestic economic and geopolitical backdrop... MJP