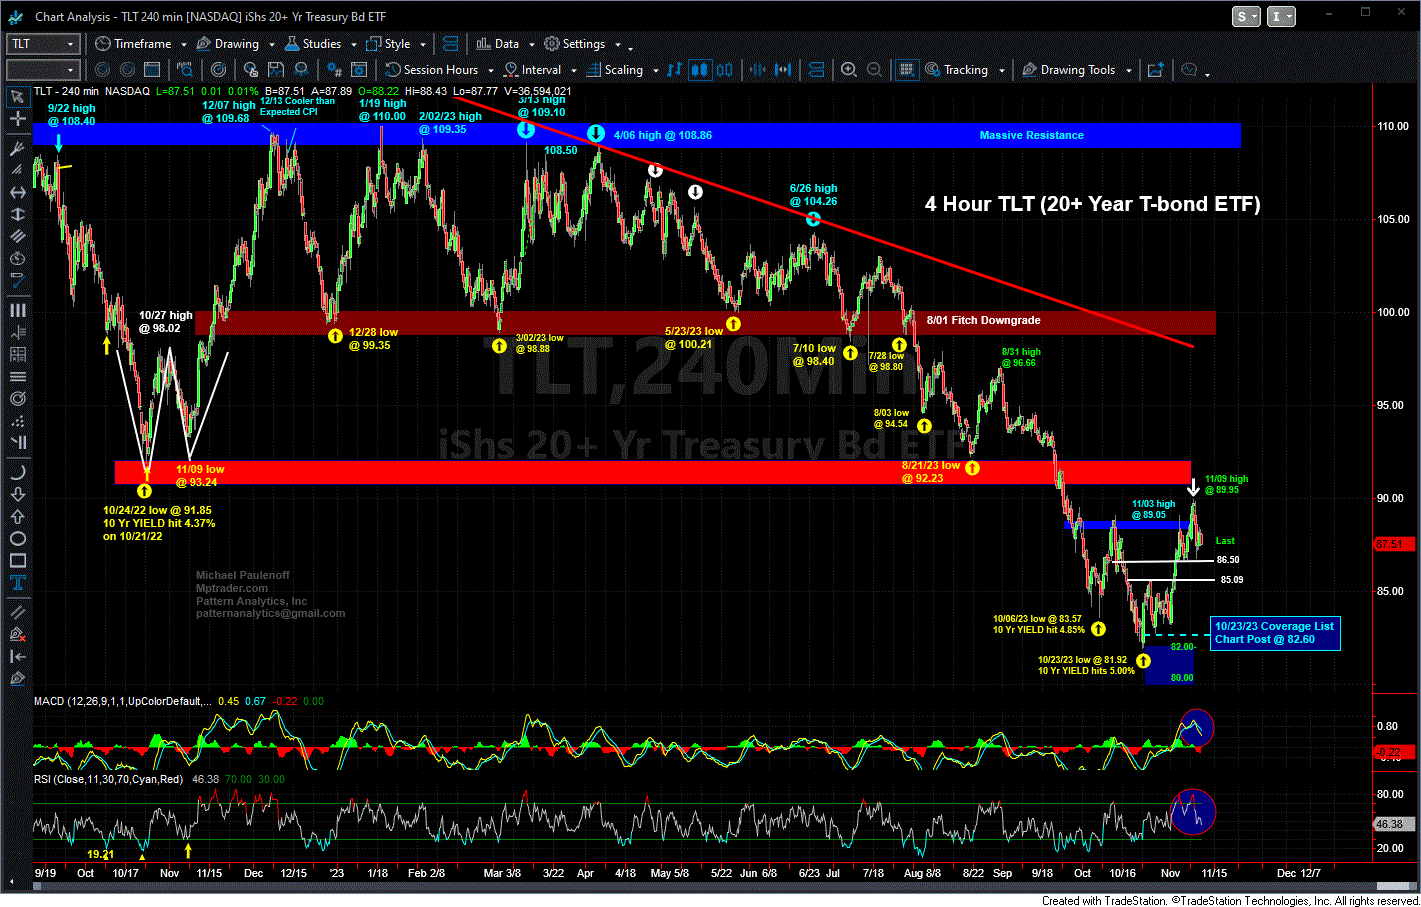
TLT (20+ Year T-Bond ETF) Shows Signs of a Near-Term Tradeable Low
On October 23, 2023, ten days before the November 1st FOMC meeting and policy statement, I posted the following commentary about the downward-spiraling TLT (20+ year T-bond ETF):
My attached 4-hour Chart of TLT shows that the relentless and near-vertical downtrend that commenced at the beginning of August from around 100 hit a new long-term low at 81.92 this AM, positioning it in my intermediate-term optimal downside target zone from 80 to 82. It IS from the 80 to 82 target zone that I am expecting a significant near-term upside pivot reversal in the hours/days ahead. Purely from a technical perspective, TLT needs to climb and sustain above resistance lodged between 83.50 and 84.70 to trigger initial upside reversal signals. Last is 82.60...
As it turned out, TLT made its bear market low at 81.92 on October 23rd (off of the March 2020 high), which also happened to represent a 16-year low as well, prior to turning up into a recovery rally that so far has stair-stepped higher by nearly 10% into last Thursday's (11/09/23) high at 89.95 (see my attached chart). The TLT low occurred into a very oversold technical condition and just prior to a series of fundamental "events" that proved to be either less bearish or potentially bullish for the bond market (lower interest rates), such as a "friendlier than expected" Quarterly Refunding requirement into year-end, a Fed decision to continue an "indefinite rate hike pause," and a weaker than expected Employment Report for October. The Fed's "pause" and the tangential relatively weak economic data combined to breathe life into the long end of the bond market just when Mr. Market appeared to have determined economic growth was too strong, inflation was too stubborn, and that the Fed intends to keep rates higher for longer.
At the moment, the long end of the bond market (TLT) is thinking more along the lines of a Goldilocks Soft-Landing for the US economy, especially in consideration of the recently supportive 20% plunge in Oil prices. Can the Fed walk the tightrope to pull it off? Who knows? For the past two weeks, both the bond and stock markets are all in on that very real probability. But what about Moody's sovereign debt downgrade to Negative from Neutral and the growing prospect of a Government Shutdown at midnight on November 17?
In the aftermath of Mike's October 23rd alert to our MPTrader members and the subsequent three-week, 10% advance, what's next for TLT? This coming week, traders and investors will have to navigate potential catalysts such as CPI, PPI, Jobless Claims, and Housing Starts as well as notable earnings from retailers WMT, TGT, and HD, overlaid on the prospect of a Government Shutdown, all of which could be impactful on the budding bottoming price action in TLT.
Join me and MPTrader members for our continuing coverage, discussions, and opportunistic strategy sessions about TLT, as well as multiple individual stocks, ETFs, macro indices, commodities, and Bitcoin...

