TMO (Thermo Fisher Scientific) Completes a Major Bottom that Ends a 3-1/2 Year Bear Phase
Nearly two months ago, I posted my technical setup on TMO (Thermo Fisher Scientific, Inc.) to alert MPTrader members to a potentially significant upside reversal pattern. Here is my commentary from June 3, 2025:
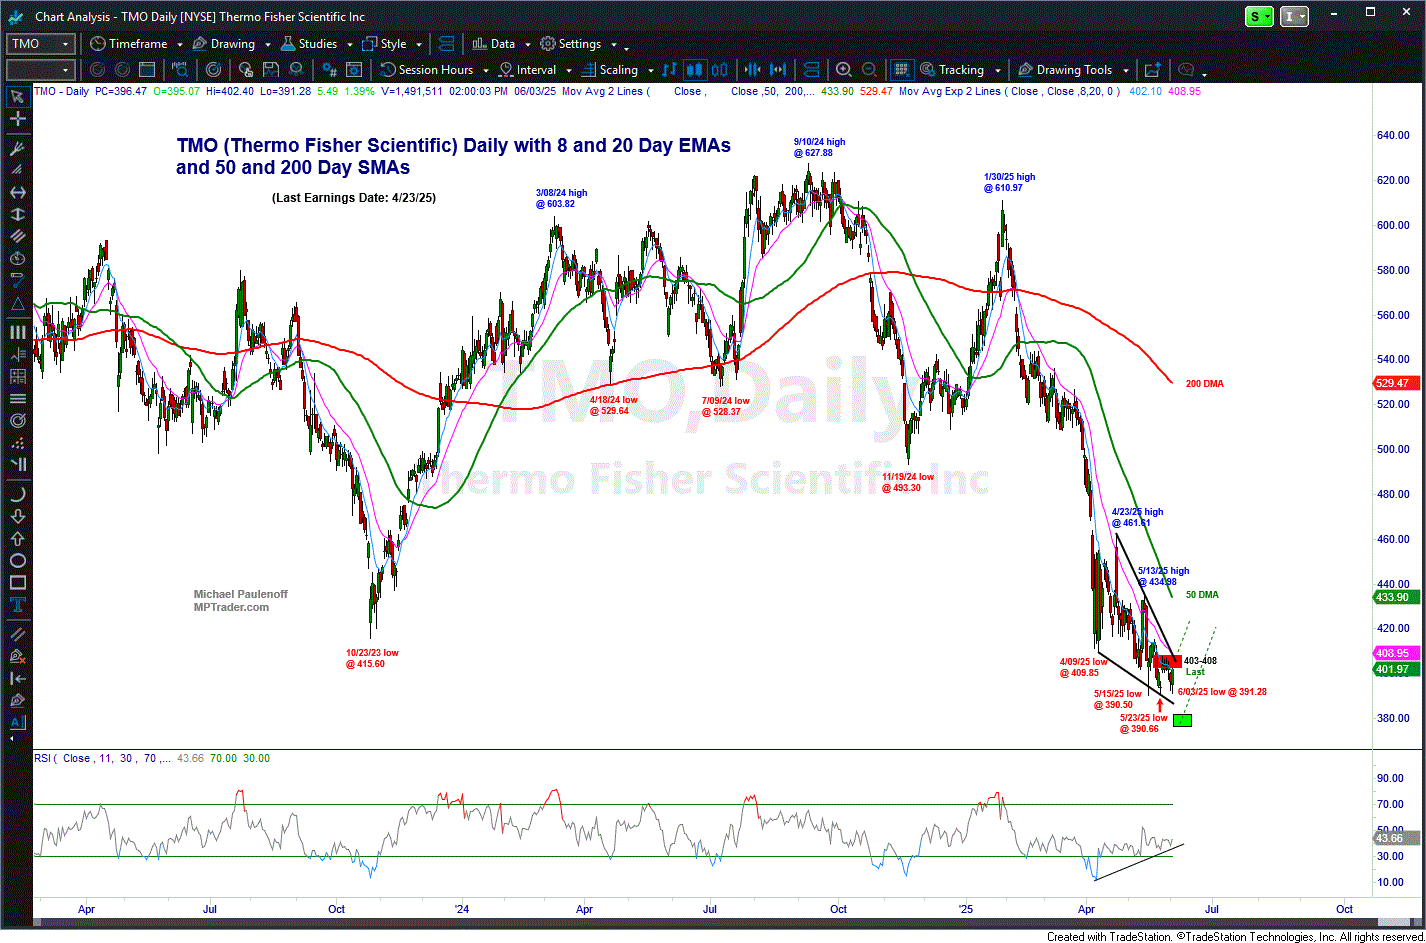
My attached Big Picture Daily Chart shows the major bear phase from the 9/10/24 ATH at 627.88 to last week's (5/23/25) low at 390.66 (-38%). Most interestingly, all of the price action from the 4/09/25 low at 409.85 has taken the form of a Falling Wedge Formation, which is usually associated with downtrend-ending corrective exhaustion ahead of a "rip-your-face-off" upside reversal. At the moment, TMO remains within the boundary lines of the Falling Wedge. A climb and close above key nearest resistance from 403 to 408 is required for my work to declare the Falling Wedge complete-- and the initiation of a potentially powerful recovery rally. Conversely, unless and until TMO closes above 408, my pattern work cannot rule out one more downside flush-out into new corrective low territory beneath 390.66 that projects to 377-382, from where my work will be expecting a vicious upside reversal signal... TMO bears watching closely in the hours and days directly ahead... Last is 401.64...
This is the visual chart setup from my June 3, 2025, update... Scroll down to see my recent and current updates...
Fast-forward to last Thursday's (7/24/25) update...
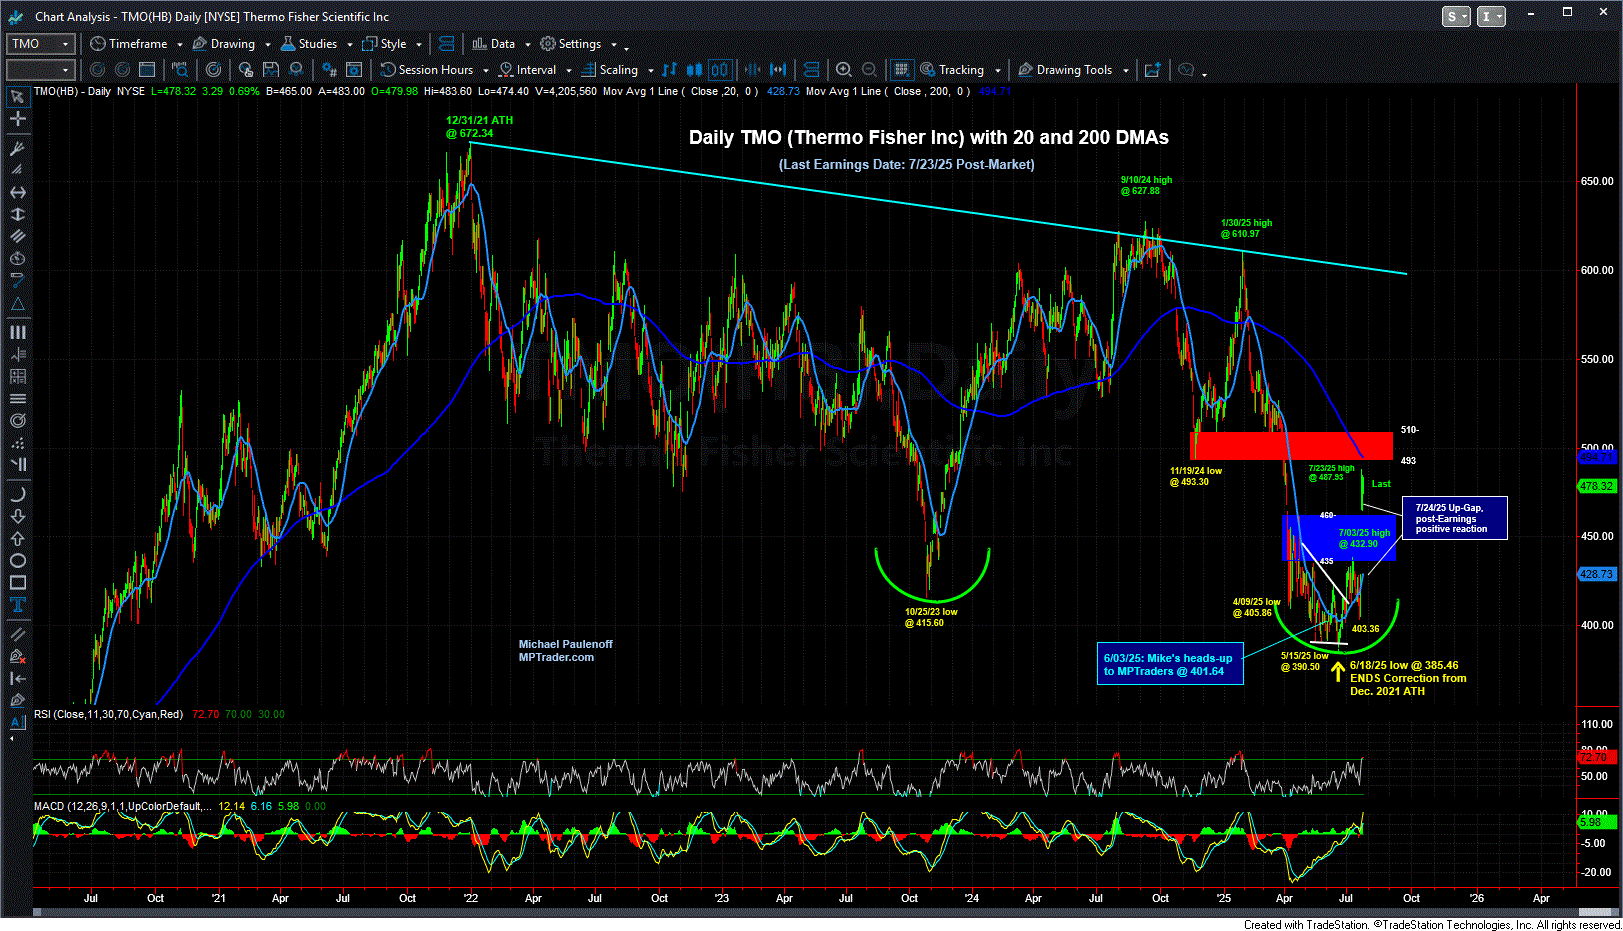
TMO (Thermo Fisher)-- I don't know if anyone stayed with my intermediate-term bullish call on TMO in the aftermath of its May-June Falling Wedge formation, but alas, it worked (!) thanks to the bullish catalyst provided by this week's Earnings report that propelled the price structure up through resistance between 435 and 460, which completed a four month bottom. Going forward, I expect a bullish digestion period above 450 before TMO takes off into another upleg that points to 500-510 en route to 540... Last is 479.73...
From the time of my initial "heads-up" on June 3, 2025, to July 24, 2025, TMO climbed to 487.93 from 401.64, or +22%. The upmove included a 4% swoon that satisfied my warning on June 3, that I cannot rule out one more downside flush-out into new corrective low territory beneath 390.66 that projects to 377-382, from where my work will be expecting a vicious upside reversal signal. TMO pressed to a final bear phase low of 385.46 on June 18, 2025 before reversing into a powerful advance (Below is my current chart from last Friday's close (7/25/25).
What's next for TMO? After a 3-/1/2 year hiatus, last week's impressive Q2, 2025 Earnings Report and expectations for a strong remainder of the year suggest TMO has turned the corner from a period of sluggish, disappointing growth. The explosive price advance that sustained during the two trading days after Earnings indicates to me that the TMO technical set up has flipped from selling rallies to buying dips during the upcoming months... Friday's close was 478.32...


