Technical Setups Indicate Higher Yield Ahead
This past week Mike Paulenoff posted his chart work for members on the benchmark 10-Year YIELD and his go-to actionable longer-term, inflation-sensitive interest rate ETF, the TLT (20+ Year T-bond ETF). There had been a series of stronger and hotter-than-expected inflation and economic data releases that surprised traders and investors, and indicated that reducing inflation to the Fed's target goal of 2% (from above 5% currently) would become more problematic in an economy that by most accounts has been, and likely will remain resistant to current Fed policy UNLESS Powell and Company ratchet-up their Fed funds "Peak Rate" in the days and weeks ahead.
With the preceding thought process in mind, here is what Mike wrote Friday afternoon:
I have posted three charts depicting longer-term (benchmark) interest rates, all of which argue for higher YIELD.
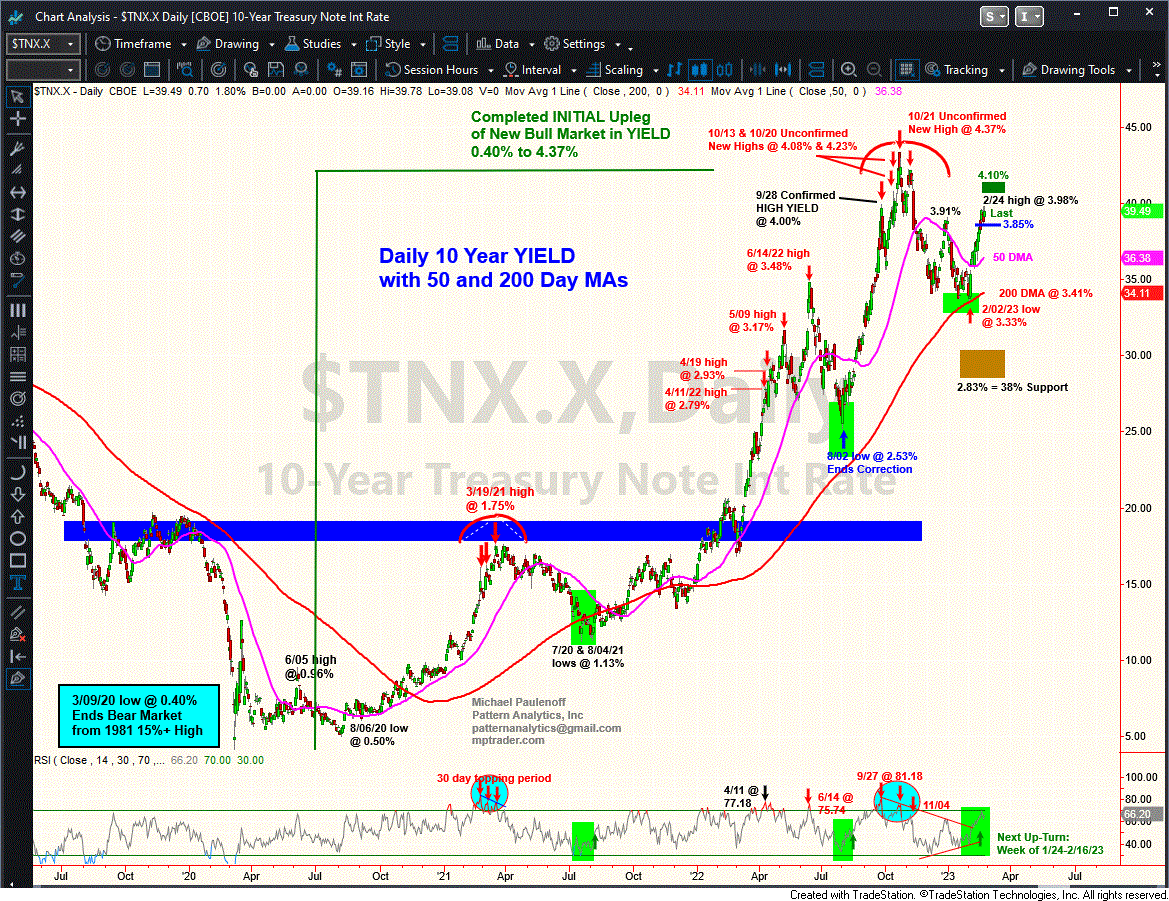
-- My Daily Chart of 10-year YIELD argues that unless and until YIELD presses back beneath 3.85% on a closing basis to trigger a preliminary downside reversal setup, YIELD points still higher, toward a 4.10% optimal upside target... Last is 3.95%
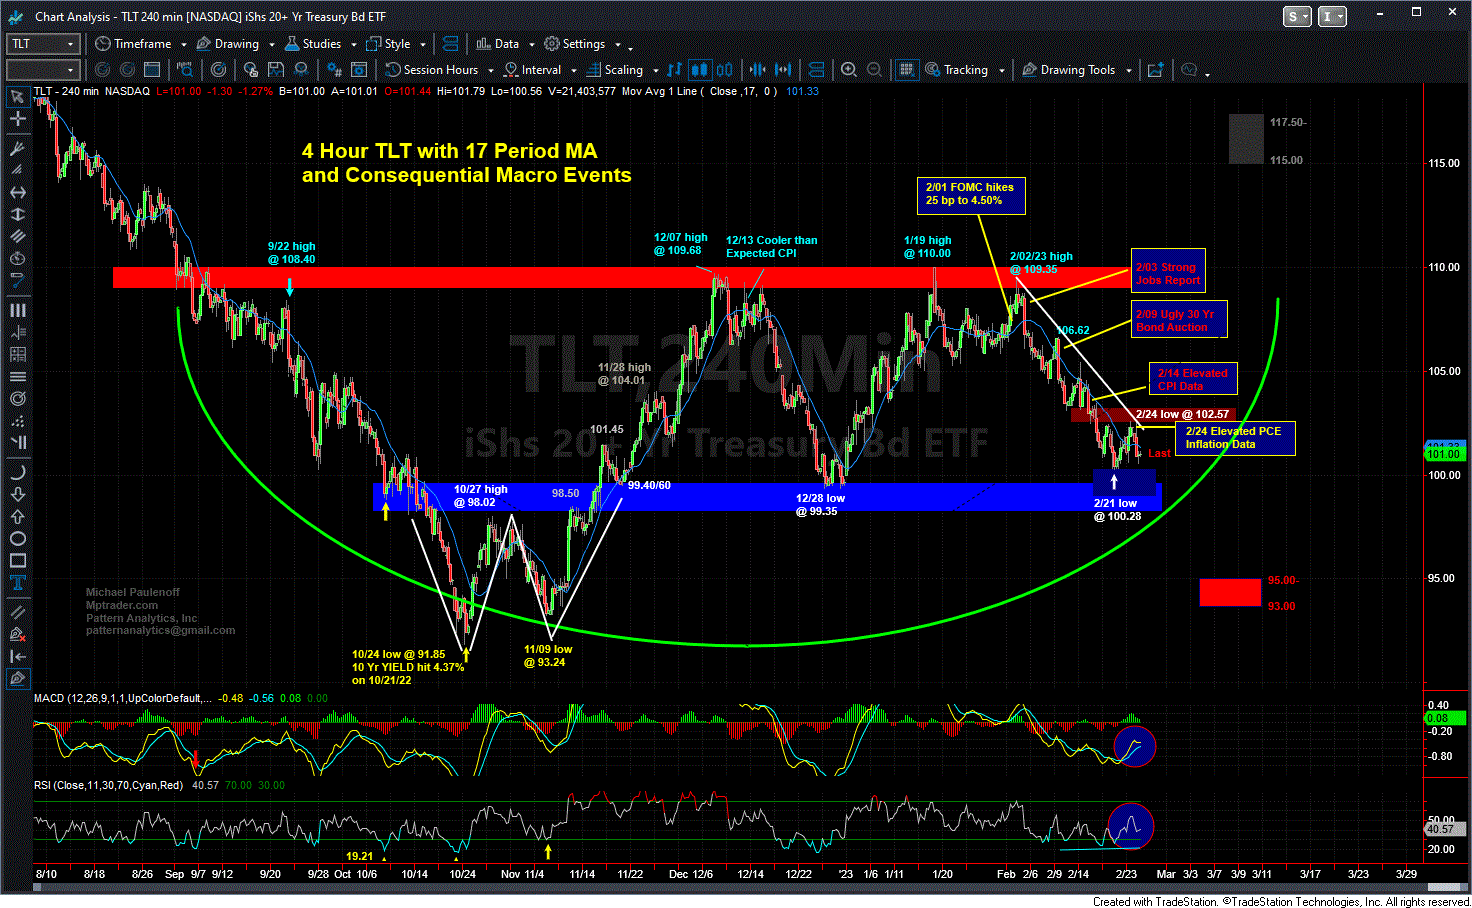
-- My attached 4-Hour Chart of TLT (20+ Year T-bond ETF) argues that unless and until TLT climbs and closes above 102.55/60, the current setup leaves the price structure vulnerable to downside continuation within the relentless February downleg toward a full-fledged retest of the 2/21/23 low at 100.26, and if violated and sustained, then to fully retest the 12/28/22 pivot low at 99.35, which MUST contain the selling pressure to avert a significant breach of multi-month support that points to 93.00-95.00 thereafter. Mike's annotations on the chart during the month of February show the series of stronger-than-expected economic data reports that elicited a negative bond market reaction for traders and investors despite Fed Chairman Powell's relatively optimistic outlook on a "disinflationary process" that he referred to during and after the February 1 FOMC meeting. TLT closed Friday at 100.96...
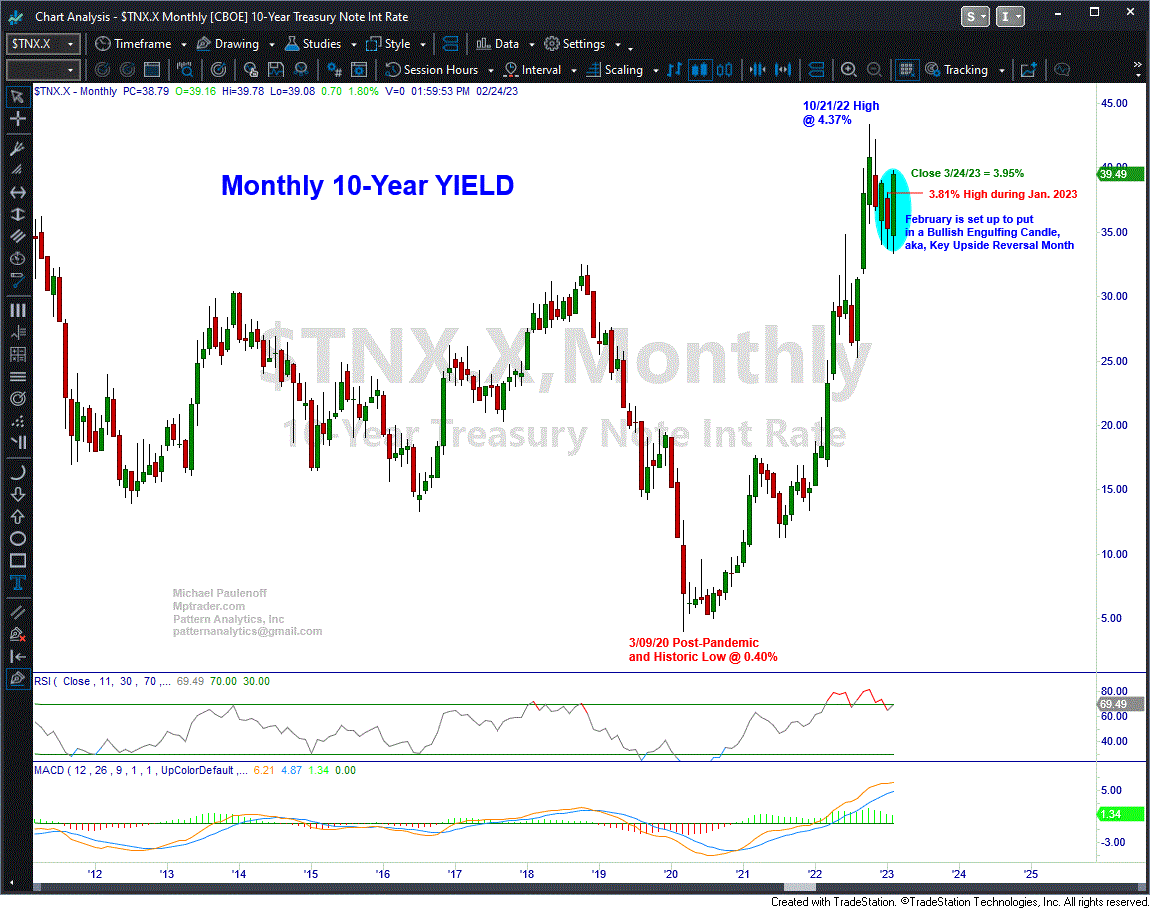
-- Lastly, my Monthly 10-Year YIELD Chart arguably the most significant of the three timeframes, shows that during the month of February, YIELD climbed from 3.33% to 3.98 (so far), and with just over two full trading sessions remaining in the month of February, is threatening to put in a Bullish Monthly Engulfing Candle, or otherwise known as a Key Monthly Upside Reversal Spike. To satisfy the criteria for a Monthly Bullish Engulfing Candle, 10-year YIELD needs to close this coming Tuesday's (2/28/23) session above the January monthly high of 3.81%. Should such a scenario unfold, the technical outlook for YIELD will receive a "technically bullish shot in the arm" that argues for upside continuation ABOVE the October 2022 high at 4.33%, and thereafter, a projection into the 4.75% to 5.10% target zone.
Mike's Bottom Line from the technical "messages" emanating from these setups: Unless there is a severe bout of strength in the bond market and a nosedive in YIELD before the close on Tuesday, the technical setups indicate higher rates are directly ahead during the month of March.
And as fate would have it, on Friday, March 10, 2023, we get the next installment of the Govt's Employment Report for February, followed by CPI and PPI on March 14 and March 15, which will be the centerpiece of critical economic data that will have the potential to drive YIELDs HIGHER, in accordance with a technical outlook that could very well be put in place this Tuesday at the close of the final day of trading for the month of February.
Login this week for Mike's and our MPTrader community's opportunistic technical and fundamental intraday discussions about how to navigate the macro market setups in TLT for instance, as well as the setups in many individual equity names (impacted by another week of earnings reports), sector ETFs, Precious Metals and Miners, FX, Commodities, and Bitcoin.


