Zoom Hits Our First Downside Target ... What's Next?

by Mike Paulenoff
October 31, 2020 • 12:00 AM EDT
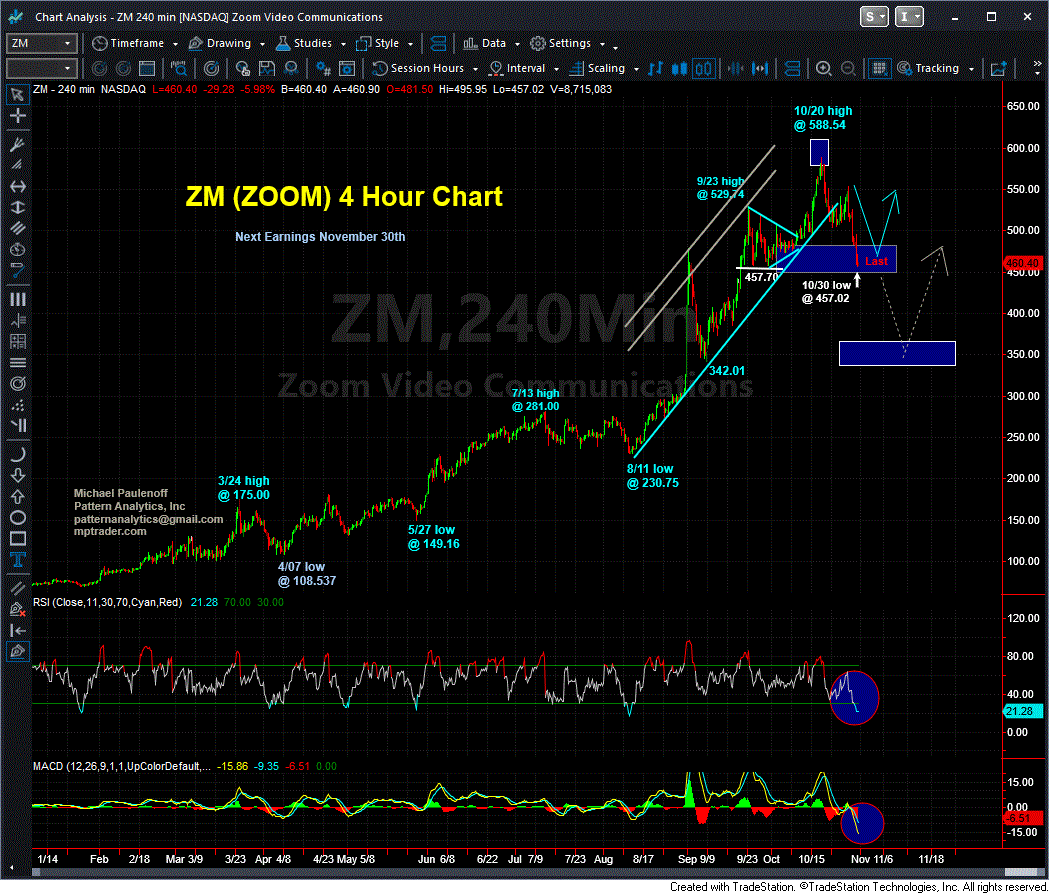
This past Tuesday afternoon, with Zoom Video Communications (ZM) at $539.50, Mike Paulenoff told MPTrader members:
"ZM followed a very technical price path into its October high at 588.54, which my work argues ended the up-leg from the August low at 230.75...The $64,000 question for me is whether or not ZM's correction will be completed in the 460-480 support zone, or slice through it towards 350-370? We will find out soon enough as we look for signals of downside exhaustion as ZM approaches the first downside support zone."
Starting the very next session (on Wednesday), ZM pivoted to the downside into a relentless decline, hitting a new reaction low at $457.02 late on Friday, prior to closing for the week at 460.91.
ZM's 15% ($82.48) plunge satisfied Mike's first downside target zone.
What's next for ZM? Is its recent weak price action merely a correction -- and a buying opportunity -- in a global pandemic that is experiencing a resurgence?
Or does the weakness reflect a potential shift in investor perceptions about the ability of the company to continue to benefit within a prolonged pandemic-challenged business environment?
Join Mike and his MPTrader community for their forthcoming analyses and discussions about ZM, in addition to many other stocks, ETFs, and indices.
Mike Paulenoff is the author of MPTrader.com, a real-time diary of his technical analysis & trade alerts
on
ETFs for precious metals, energy, currencies, and an array of equity indices and sectors, including
international
markets, plus key ETF component stocks in sectors like technology, mining, and banking.
Sign up for a Free 7-day Trial!
Thirty minutes after the opening bell on November 24, 2025, I posted the following heads-up to MPTrader members about the technical setup in META:META has the right technical look of a significant U-Turn to the upside after completing a 27% August-November correction from 796.25 (8/15/25) to 580.32 (11/21/25)... To gain more powerful upside traction, META needs to climb and sustain above nearest-term resistance at 614.70 to 616.50, which if (when) taken out, will open a higher price pathway to the 670 area to challenge the down-sloping 200 DMA... Last is 609.27...
Last Friday morning, to calm frazzled nerves amid a 1% pre-market plunge that was threatening to complete a 100% give back of the prior week's 3.
Late on Friday, fellow MPTrader member MarkinQueens exclaimed: Mike's XOM (Exxon Mobil) chart from August is working! Last $117.26!Back on August 25th, this is what we discussed about Crude Oil and XOM:Just in case anyone is wondering what the chart of nearby Crude Oil is looking like as we approach the "official" end of summer.
On August 12, 2025, this was my response to an inquiry from an MPTrader member about intense weakness impacting SMR (NuScale Power Corp):SMR (NuScale Power)-- Fellow member Irv66 asked for an update on this modular nuclear reactor manufacturer that blasted-off from 11.08 in early April to 53.50 at the end of July (+382%), but has since been in the grasp of a major correction from 53.50 to 38.33 (-28.6%). My pattern work argues that SMR is nearing key support from 37.50 down to 33.
ARKK (ARK Innovation Fund, ETF)-- Back on August 20, 2025, this is what we discussed about ARKK:Fellow member Pawel has requested an update on Cathie Wood's fund, which in June thrust up and out of a 3-1/2 year base-accumulation period and pattern above 68.40/50 that subsequently climbed to my initial target in the vicinity of 80 (see my attached Daily Chart). Since the 7/21/25 high at 79.