AAPL Peaks Just Above Our Target ... What's Next?

by Mike Paulenoff
March 12, 2022 • 12:00 AM EST
Two weeks ago, in our Top Call piece entitled, "Calling AAPL's Twists and Turns," we highlighted Mike Paulenoff's warning that "as goes Apple, so goes the market."
We also noted that despite what looked like a significant corrective low and upside reversal in AAPL on Thursday Feb 24, Mike was warning MPTrader members to stay nimble despite an apparent near term upside reversal in AAPL.
He wrote, "We should NOT BE SURPRISED to see AAPL roll over into another nosedive that RETESTS and possibly marginally violates [the Feb 24] low-zone at 151.90 to 152.40 prior to entering a rally phase... expecting AAPL to stall and to pivot to the downside from the 165 to 167.70 resistance area into a decline that will have the potential to revisit [the Feb 24] low [at 151.90]."
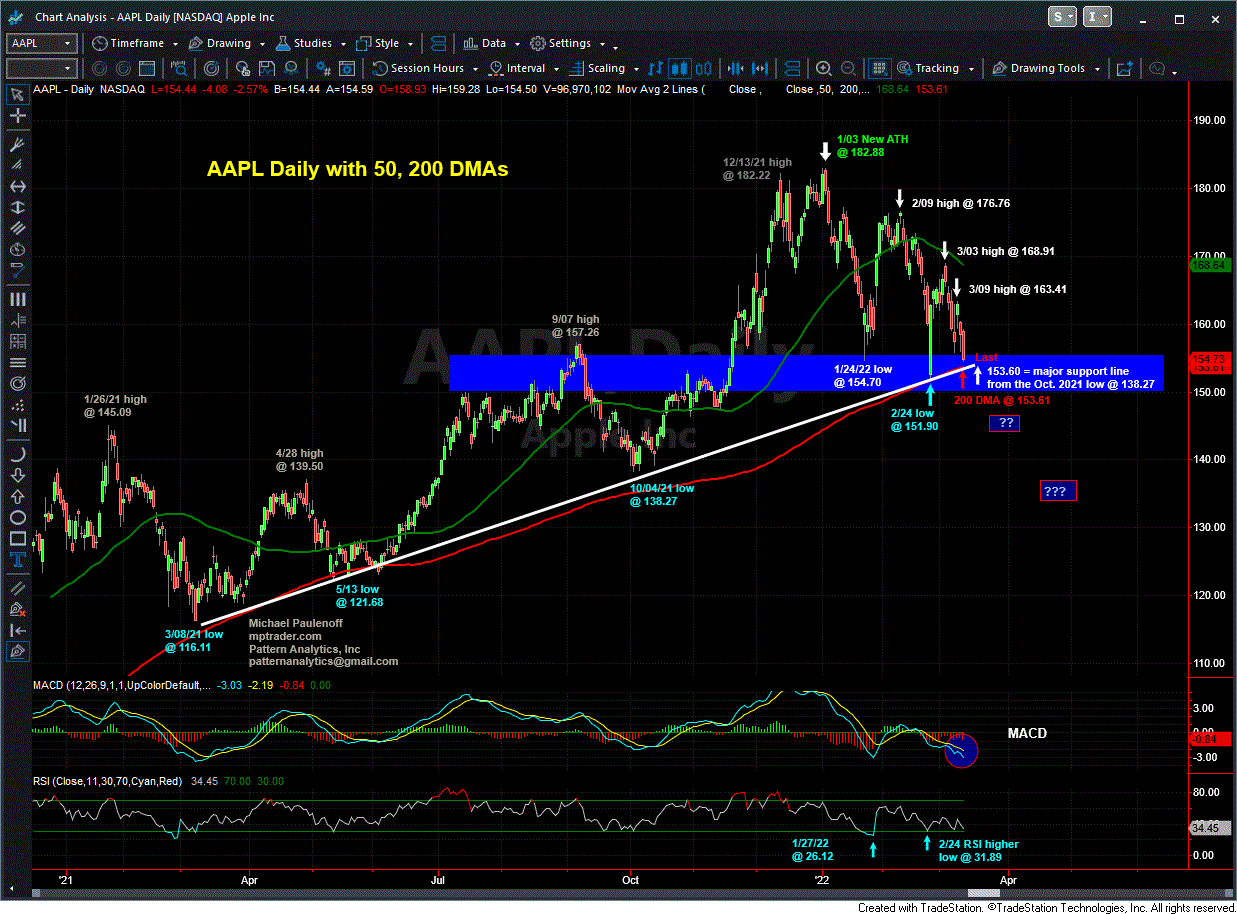
Fast-forward to last week, and we see on Mike's daily AAPL chart (below) that AAPL's post-Feb 24 rally peaked at 168.91 -- just above Mike's optimal peak zone of 165-167.70 discussed two weeks prior -- which initiated a new downleg that pressed to Friday's low at 154.50, closing at 154.73.
Let's notice that AAPL's price structure currently is pointed straight down, pressing towards a very significant support zone from 151.90 to 153.60 that encompasses 1) the dominant support line off of the October 2021 low that cuts across the price axis in the vicinity of 153.60, 2) the 200 DMA at 153.61, and 3) the Feb 24 low at 151.90.
If this support zone is violated and sustained, the intermediate-term technical setup in AAPL will deteriorate meaningfully, and its multi-month pattern will morph into a Crown Top Formation.
Entering next week, amid the constant uncertainty and turmoil that pervades geopolitics, monetary policy, and financial markets, AAPL again is on Mike Paulenoff's mind. While the stock remains one of only 23% of NYSE companies still trading above its 200 DMA, a close beneath 153.60 (its 200 DMA) will further weaken AAPL as a bellwether name, as well as many related equity indices and index ETF's containing mega-cap AAPL and AAPL suppliers.
Join Mike and mptrader members for in-depth market discussions and chart analysis throughout every trading day that focuses on individual stocks, ETFs, macro indices, commodities, and Bitcoin.
Eight weeks ago, Mike Paulenoff discussed the budding technical setup and upside breakout in CRWD (CrowdStrike Holdings) with our MPTraders members, writing:"CRWD has followed the bullish scenario we discussed in late August, and in fact, today (10/06/23) has thrust above 5 months of resistance to new recovery high territory at 176.32. Although my next optimal upside target zone is 190-200, the BIG picture setup points to 230-240 thereafter... Last is 174.86...
On Monday morning, November 13, 2023, a full 5 trading sessions before the approaching November Options Expiration (OPEX) (11/17/23), I posted my chart-based commentary for our members:SPY-- Considering that Friday is November Option Expiration, where are the "magnetized strike prices" as we start OPEX week? Based on my attached Hourly Chart, the magnetized strike price zone spans from 436 to 441. Should SPY take out the upside barrier of 441, then the follow-through outlier magnetized target could be as high as 450 before or on Friday.
On October 23, 2023, ten days before the November 1st FOMC meeting and policy statement, I posted the following commentary about the downward-spiraling TLT (20+ year T-bond ETF):My attached 4-hour Chart of TLT shows that the relentless and near-vertical downtrend that commenced at the beginning of August from around 100 hit a new long-term low at 81.92 this AM, positioning it in my intermediate-term optimal downside target zone from 80 to 82.
On the afternoon of September 25, Mike Paulenoff posted a warning signal to MPTraders members about the developing acute oversold condition in RTX (formerly Raytheon Technologies), writing:"RTX (formerly Raytheon Technologies) hit a new multi-month corrective low of 71.02, down 33% from the 4/10/23 post-pandemic High at 106.02. Although RTX has violated my optimal target window of 73-75, the stair-step corrective pattern off of the 4/19/23 high at 104.
On October 3, Mike Paulenoff posted the following "Heads Up!" about GLD (SPDR Gold Trust, ETF) for MPTrader members: "GLD has pressed to an important technical inflection window from 169.50 down to 166.30, from where I will be expecting corrective downside exhaustion off of the 5/04/23 high at 191.36, and new buying interest. From a nearer-term perspective, given the acute oversold but CONFIRMED Momentum reading of 17.16 an hour ago, my preferred scenario argues for another loop down that marginally violates today's low at 168.