Getting Ahead Of Rally In Retail Sector ETF

by Mike Paulenoff
May 15, 2021 • 11:29 AM EDT
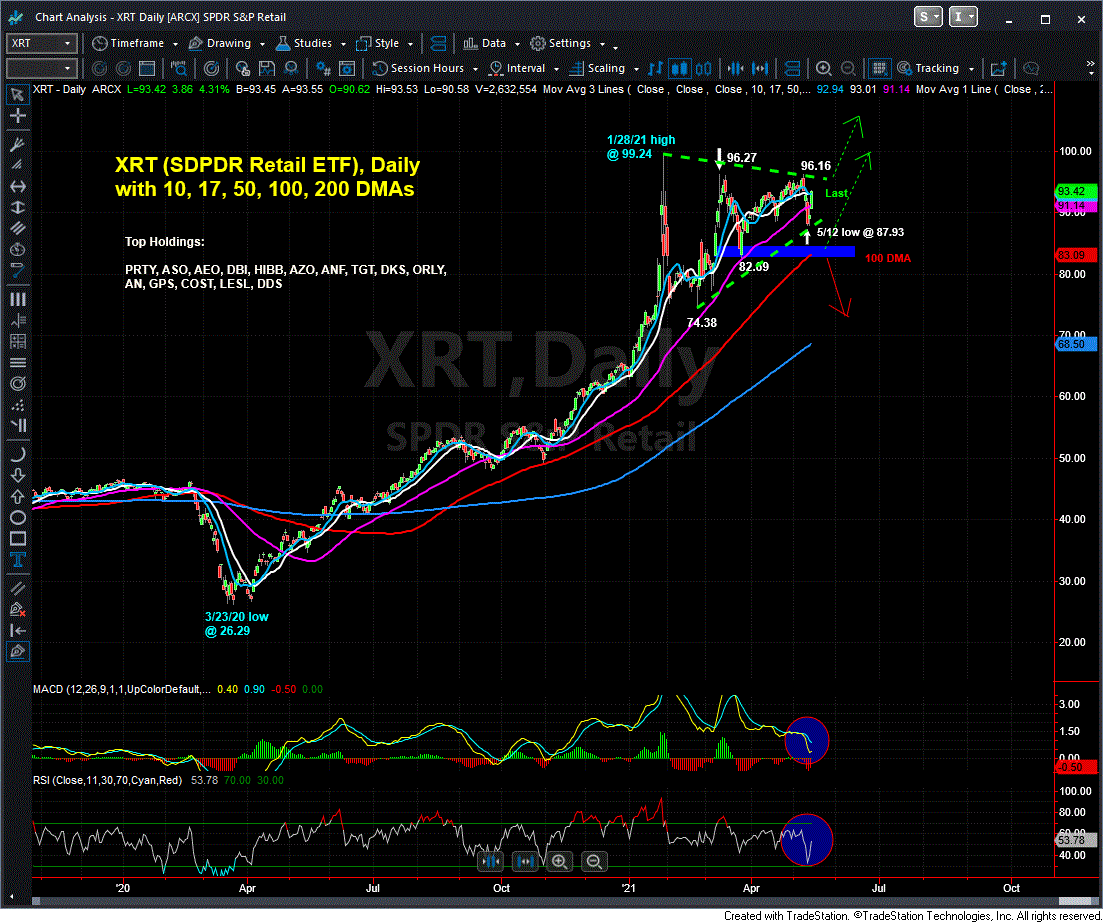
This past Friday, 30 minutes before the release of Retail Sales data for April, Mike Paulenoff posted his analysis of XRT, the SPDR S&P Retail Sector ETF.
After explaining in detail his analysis, which you can read here, Mike concluded: "All of the action from the Jan. 28th high at 99.24 through Tuesday's (May 12th) higher pullback low, represents a larger, bullish digestion period and pattern atop the dominant 15 month uptrend. In addition, based on my experience, the Coil type pattern that has been carved out has the requisite number of traverses across the contracting range to be considered complete or nearly complete, which if reasonably accurate, argues for the emergence of a new upleg in the XRT that propels the Retail ETF to new highs above 100, with an outlier upside target zone of 108 to 112."
XRT, trading at 89.56 at the time, proceeded to gap up to 90.60/65 at the open, despite a disappointing Retail Sales report. It clawed its way higher for all of Friday's session, closing at 93.42, a full 4.3% above its pre-market price at Mike's alert, and 3% above its up-gap opening price. This indicated strongly that the bullish pattern described by Mike in his early AM analysis to MPTader members was "calling the shots" for the XRT regardless of the apparent hiccup in April Retail Sales.
Where is XRT headed next? Based on Mike's analysis, XRT hasn't even broken out of its multi-month bullish digestion pattern yet.
Join Mike and our members in our MPTrader room as they analyze, discuss, and project the upcoming price action in XRT, as well as other names, ETFs, macro sector indices and futures, cryptos, commodities, and more.

Mike Paulenoff is the author of MPTrader.com, a real-time diary of his technical analysis & trade alerts on
ETFs for precious metals, energy, currencies, and an array of equity indices and sectors, including international
markets, plus key ETF component stocks in sectors like technology, mining, and banking.
Sign up for a Free 7-day Trial!
More Top Calls From Mike
Thirty minutes after the opening bell on November 24, 2025, I posted the following heads-up to MPTrader members about the technical setup in META:META has the right technical look of a significant U-Turn to the upside after completing a 27% August-November correction from 796.25 (8/15/25) to 580.32 (11/21/25)... To gain more powerful upside traction, META needs to climb and sustain above nearest-term resistance at 614.70 to 616.50, which if (when) taken out, will open a higher price pathway to the 670 area to challenge the down-sloping 200 DMA... Last is 609.27...
Last Friday morning, to calm frazzled nerves amid a 1% pre-market plunge that was threatening to complete a 100% give back of the prior week's 3.
Late on Friday, fellow MPTrader member MarkinQueens exclaimed: Mike's XOM (Exxon Mobil) chart from August is working! Last $117.26!Back on August 25th, this is what we discussed about Crude Oil and XOM:Just in case anyone is wondering what the chart of nearby Crude Oil is looking like as we approach the "official" end of summer.
On August 12, 2025, this was my response to an inquiry from an MPTrader member about intense weakness impacting SMR (NuScale Power Corp):SMR (NuScale Power)-- Fellow member Irv66 asked for an update on this modular nuclear reactor manufacturer that blasted-off from 11.08 in early April to 53.50 at the end of July (+382%), but has since been in the grasp of a major correction from 53.50 to 38.33 (-28.6%). My pattern work argues that SMR is nearing key support from 37.50 down to 33.
ARKK (ARK Innovation Fund, ETF)-- Back on August 20, 2025, this is what we discussed about ARKK:Fellow member Pawel has requested an update on Cathie Wood's fund, which in June thrust up and out of a 3-1/2 year base-accumulation period and pattern above 68.40/50 that subsequently climbed to my initial target in the vicinity of 80 (see my attached Daily Chart). Since the 7/21/25 high at 79.

